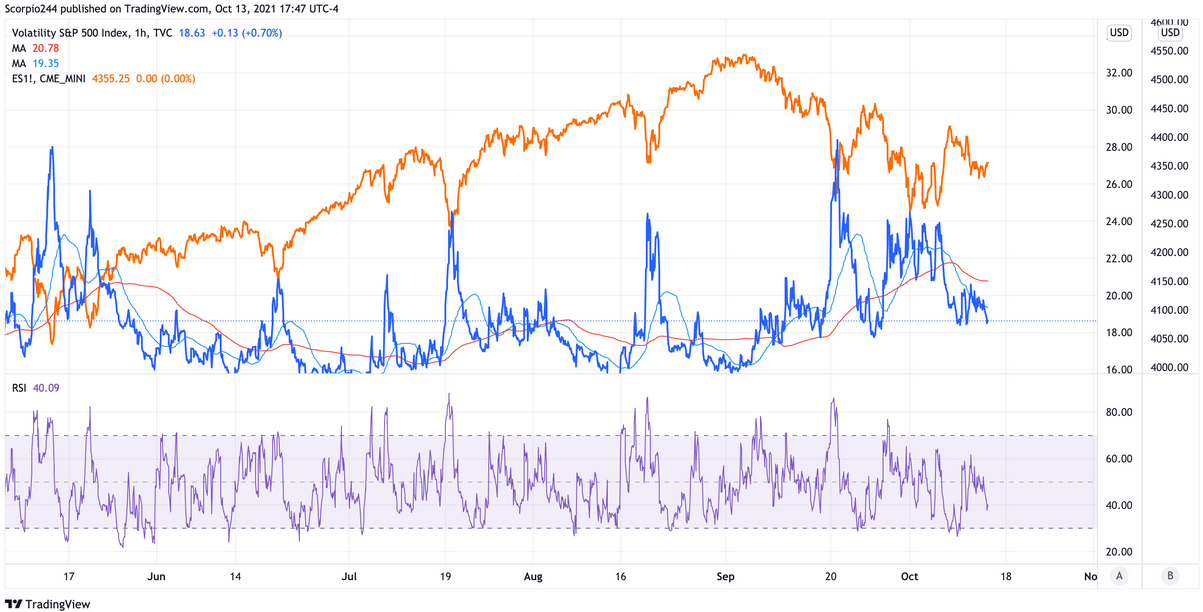
The was up Wednesday, rising by around 30 bps. It was an uninspiring rebound in the market. One would have thought with the down 50 bps and the dropping to roughly 18.5, the outcome would have been a much more significant gain.
The VIX falling does not have the same impact as it once did, and perhaps it is because the reflexive action of the implied volatility melt is much smaller. As a result, you get an S&P 500 that gains just 30 bps. I guess you have to wonder what it is going to take to get the market moving higher. It is an excellent question. Is the VIX falling to 16 going to get the index back to 4,550? When going from 20 to 18.6 over the past two days, got a big 30 bps rally? Good luck.
At this point, I would be more worried about the market falling and the VIX spiking to say 24 or 25, which would likely result in a considerable decline in the index. This market has become too mechanical and too tied to the options market. It is so apparent. Just look at the orange line (S&P 500) and compare its peaks and troughs with the blue (VIX).
U.S. Dollar
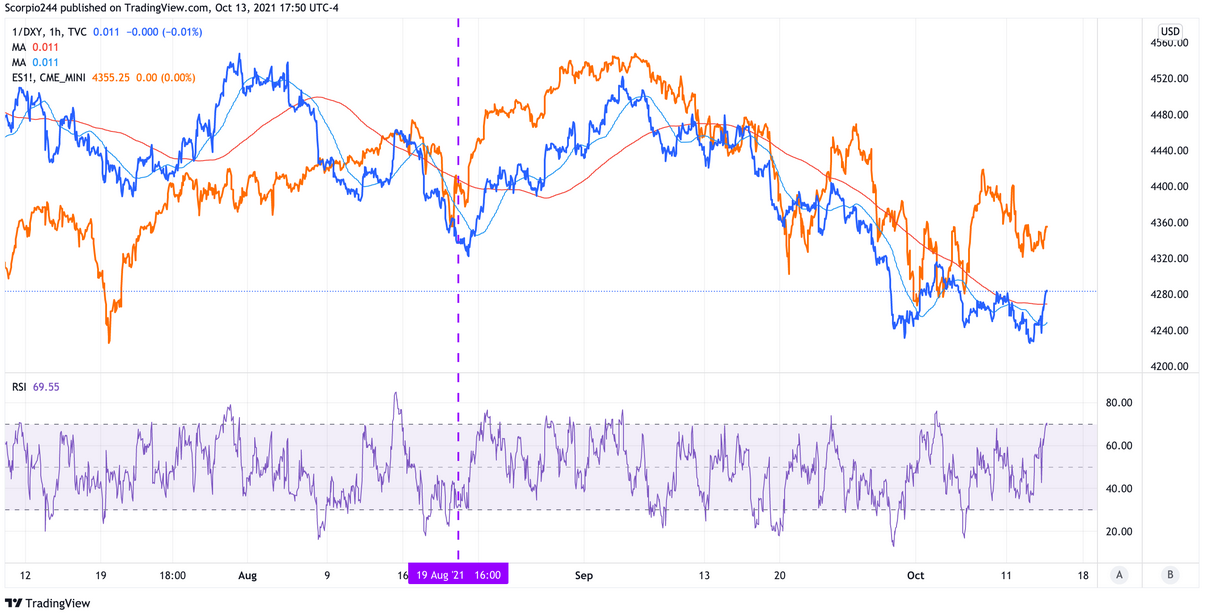
Even with the dollar down big on Wednesday, it was no real help for stocks. Look at the relationship between the dollar and S&P 500 from the dotted purple line on the right. The chart has the inverted in blue, with the in orange. So when the dollar rises, the S&P 500 falls. The dollar was down pretty big today, yet the S&P 500 did very little.
Apple
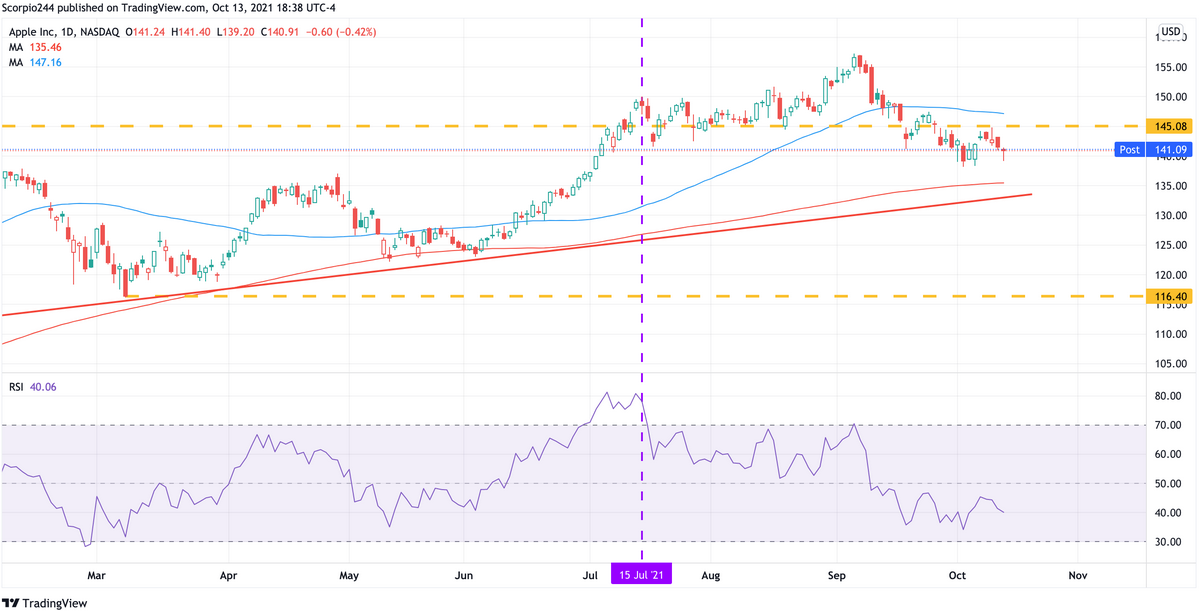
Apple (NASDAQ:) fell yesterday, but the market seemed to blow off the news about the iPhones. The stock was still down about 40 bps, but not nearly as much as one would have expected. I don’t think anything changes from Tuesday, with the shares still on pace to drop to the trend line around $132.
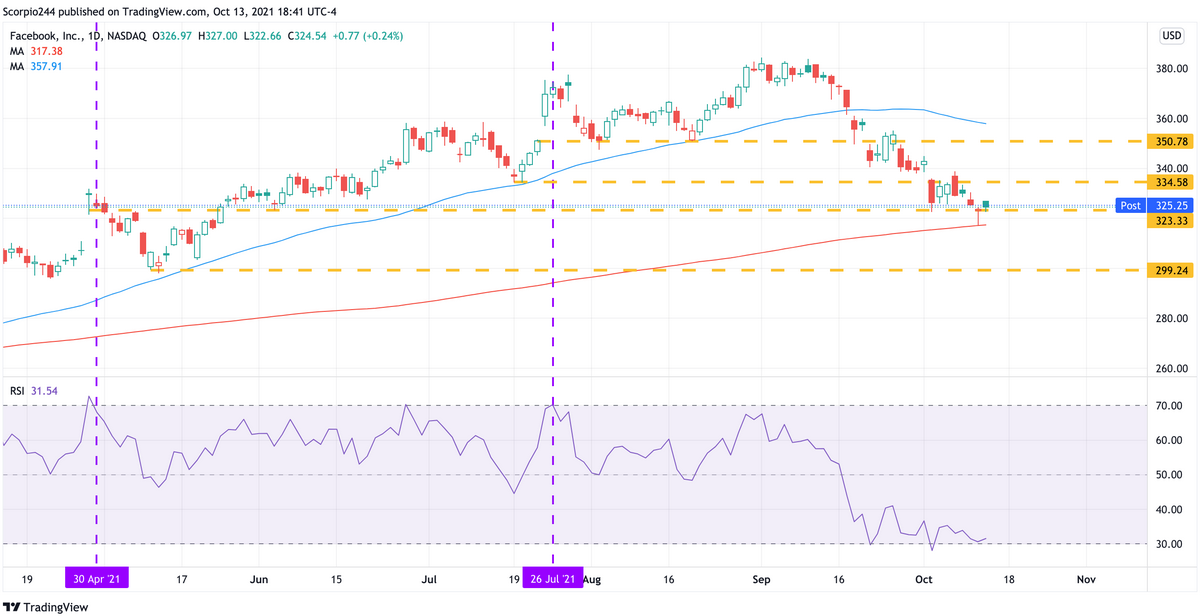
Facebook (NASDAQ:) looked oversold at this point, and it managed to hold on to support at the 200-day moving average for now. Still, it is likely to rise a bit from here, with $325 the optimal target as we head into earnings.
Tesla
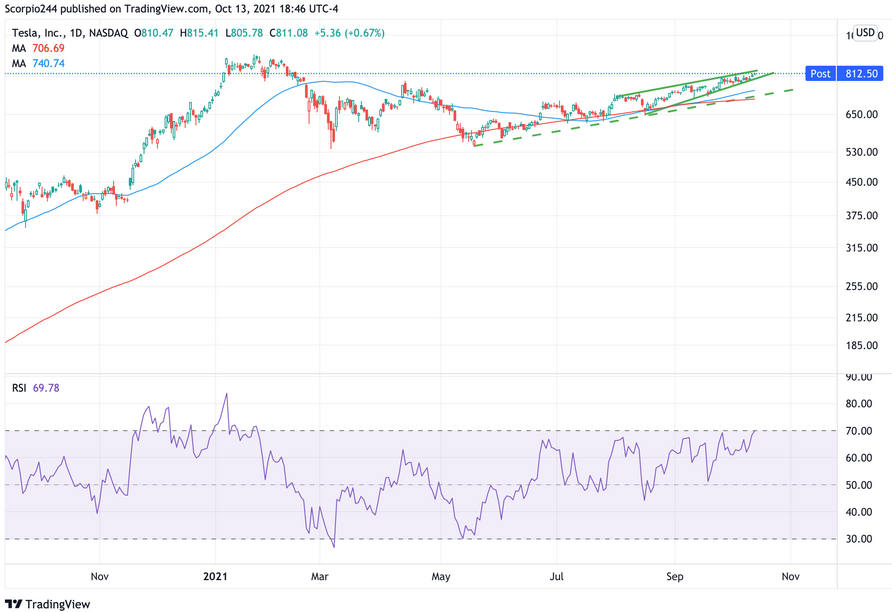
Tesla (NASDAQ:) looked like it had formed a rising wedge pattern, and that is a bearish reversal pattern. It was accompanied by an RSI that is now overbought. A drop below $795 probably sets up a drop to around the $ 720s to start.
