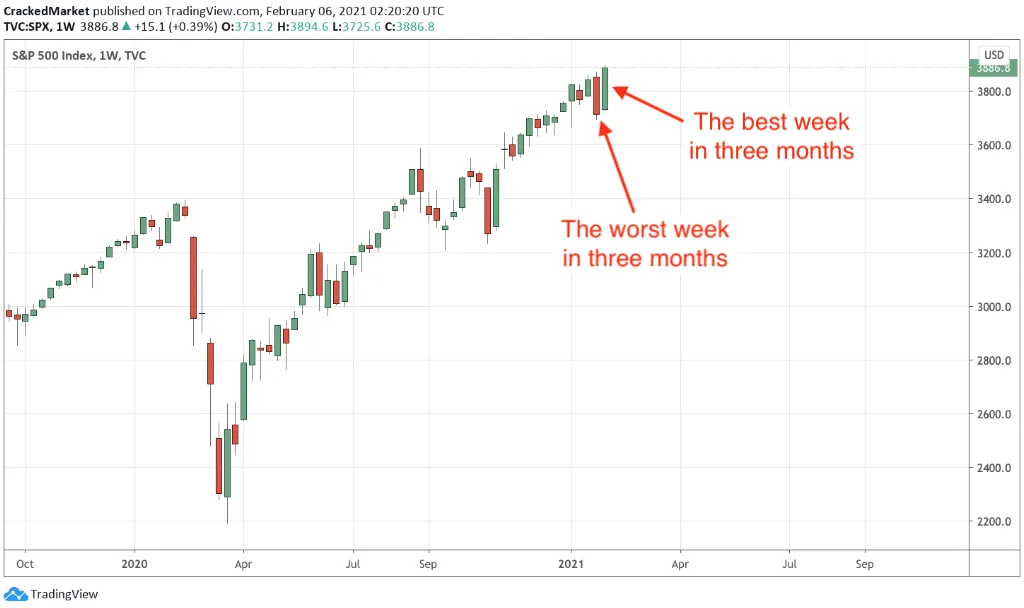
 S&P 500 Index Weekly Chart
Two weeks ago was the S&P 500’s worst week since right before the election (-3.3%). This past week was the index’s best week since the election (+4.7%). Funny how that works.
Every week has economic news, but two weeks ago nothing rose to the level of, “the worst economic developments in three months.” Just like nothing last week was, “the best economic news in three months.”
Instead, both weeks' volatility was driven by swings in investor sentiment, primarily affected by a spectacular bubble in a few fringe stocks.
Two weeks ago, this out-of-control fire threatened to spread to the rest of the market. While investors were willing to accept stretched valuations in the best-of-the-best stocks, they were not willing to tolerate it in nearly bankrupt video game retailers and movie theater chains.
But over the previous weekend, those bubbles burst without taking anything else down with them and the indexes have been rallying in relief ever since, finishing last week with five consecutive gains.
What does this week hold? More of the same. While we won’t be able to match “the best week in three months,” the index will continue grinding away at record highs.
As much as the cynics love to hate this Teflon market, the one thing we know about fragile and vulnerable markets is they don’t keep making record highs. What is high tends to get even higher and that is definitely the case here.
Stick with what has been working and that is riding this relentless rally higher.
Leave a comment