S&P 500 earnings update
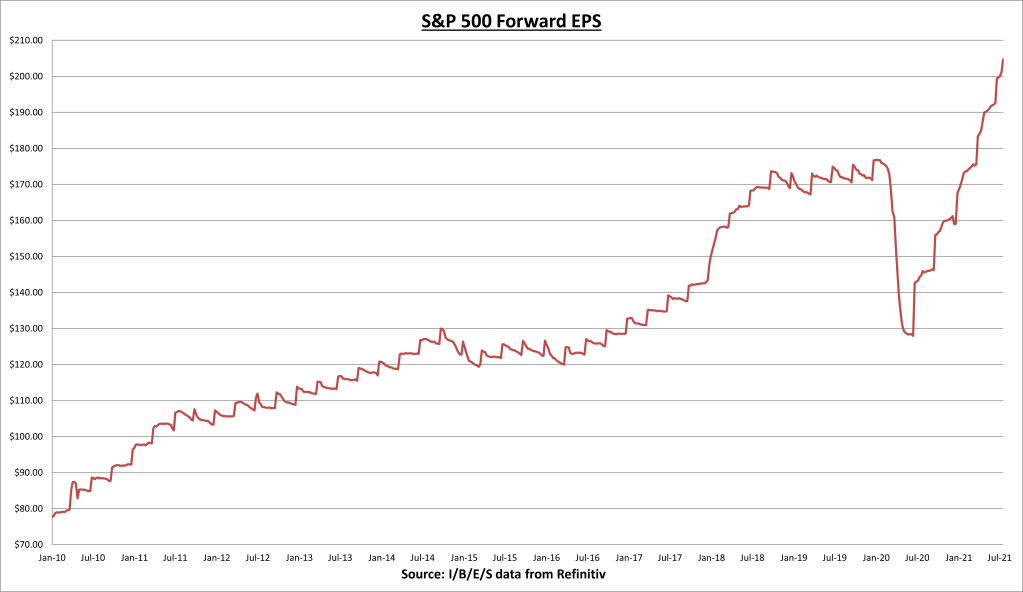
S&P 500 earnings per share (EPS) increased to $204.70 last week. The forward EPS is now +28.7% year-to-date.
About 60% of the has now reported Q2 results. 89% have beaten earnings expectations, and results have come in a combined 16.7% above estimates. Q2 earnings growth is now +89.8%.
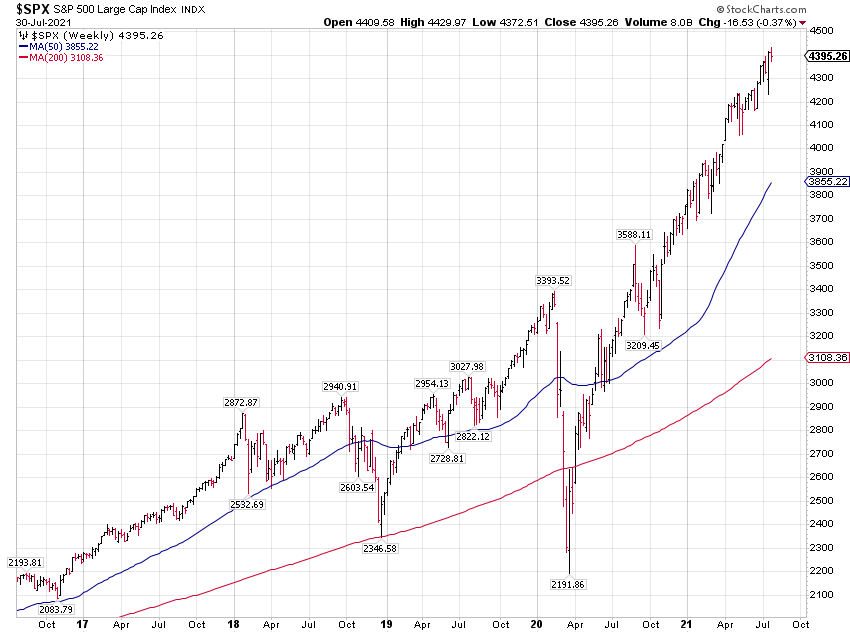
The S&P 500 index declined -0.37% for the week.
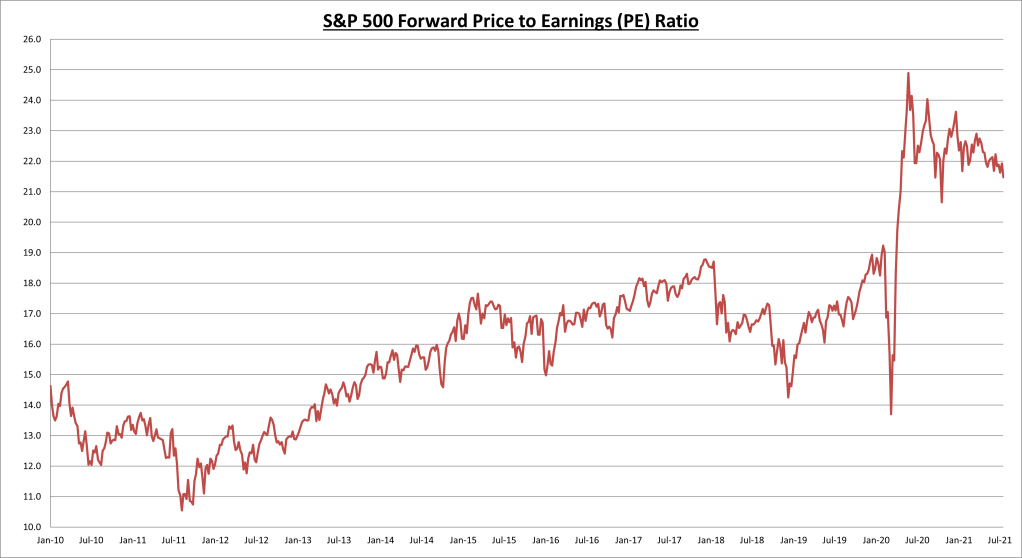
S&P 500 price to earnings (PE) ratio declined to 21.5.
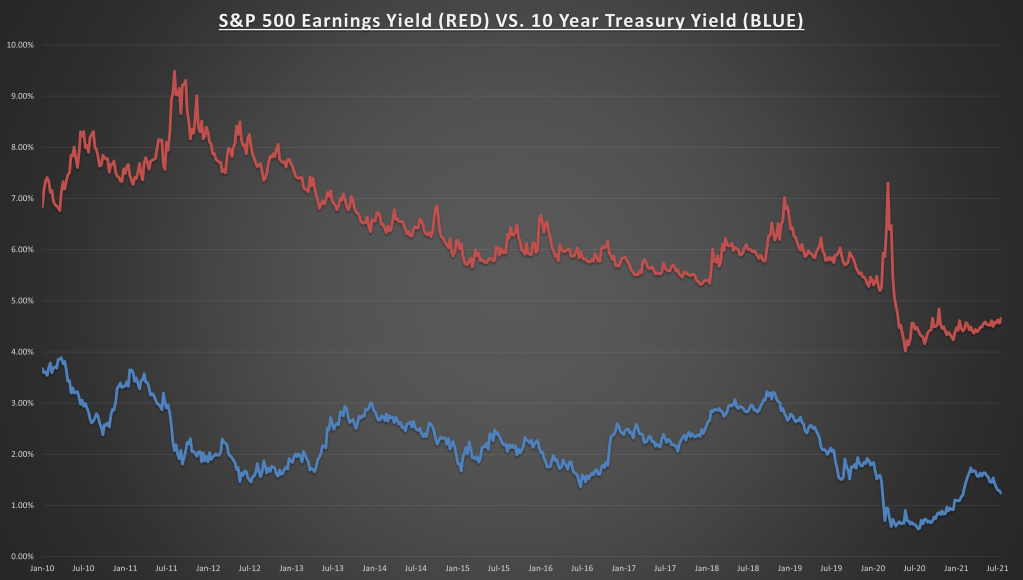
S&P 500 earnings yield is now 4.66%, compared to the treasury bond rate which declined to 1.23% last week. The equity risk premium is now 3.42%, nearing a 6 month high. The decline in bond rates plus the increase in earnings is making the S&P 500 valuation remain attractive despite hitting all time highs.
Economic data review
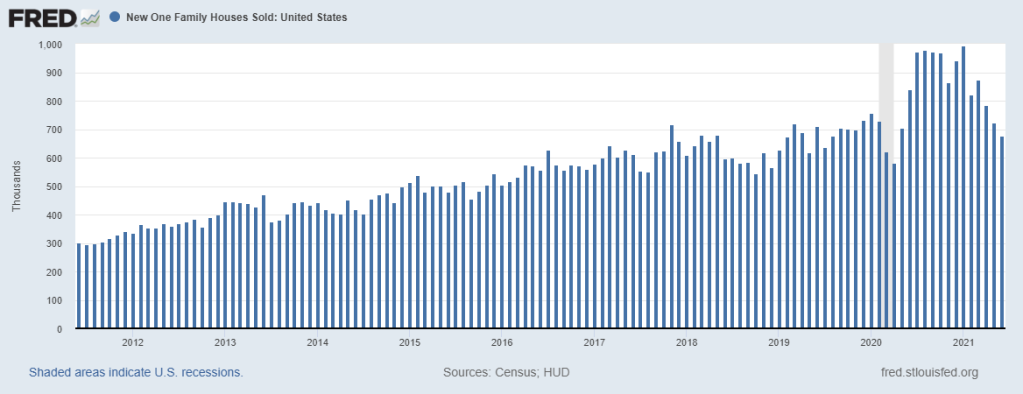
New home sales for June came in at , the 3rd straight monthly decline. This represents a decline of -6.6% for the month (which was also revised lower), and -19.4% annualized. The decline was led by the Northeast (-21% for the month, -40% annualized), while the Midwest was the only region to see a monthly increase (+5.7%).
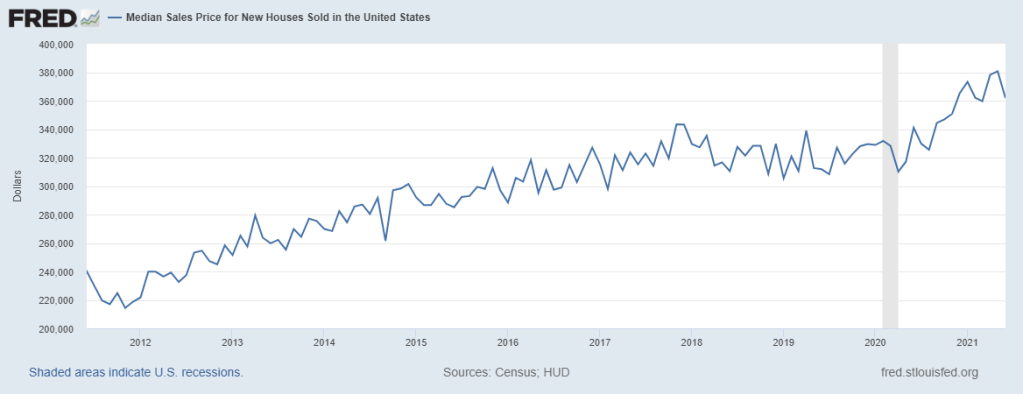
The median sales price for new homes declined to $361,800, which was -4.96% below last month but still +6.1% higher than at this time last year. This report was a big miss no matter which way you look at it. There is a saying, “the cure for higher prices, is higher prices.” Higher input costs for builders, plus some sticker shock for buyers, is most likely behind the decline.
Monthly data can be volatile even during normal times. I suspect pandemic related factors are the main culprit here. If we look at a 6 or 12 month moving average of new home sales, it remains near the high point of the post 2008 expansion. I don’t see this as a threat to the economic expansion, but it bears monitoring.
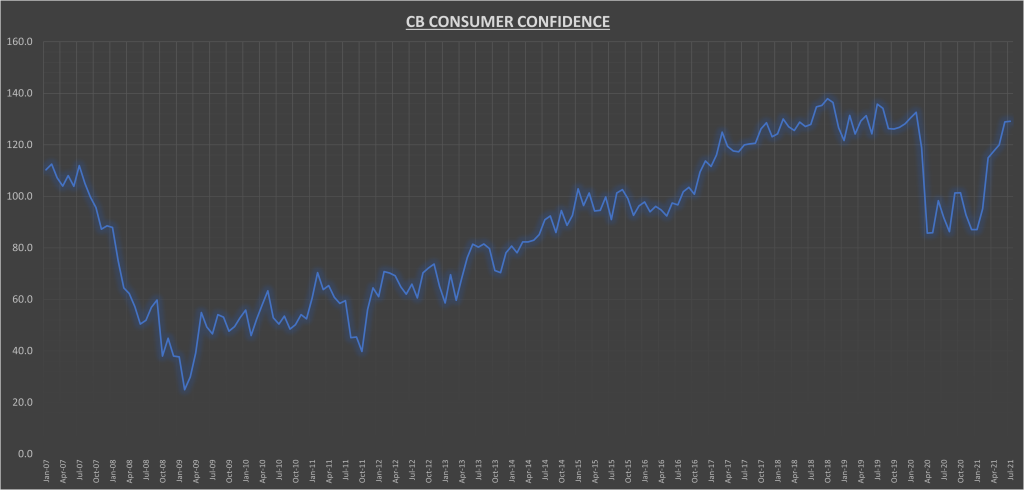
Consumer Confidence index came in at for July, +0.2% higher than last month (which was revised up from 127.3 to 128.9), and +40.8% annualized.
“Consumers’ appraisal of present-day conditions held steady, suggesting economic growth in Q3 is off to a strong start. Consumers’ optimism about the short-term outlook didn’t waver, and they continued to expect that business conditions, jobs, and personal financial prospects will improve.
“Short-term inflation expectations eased slightly but remained elevated. Spending intentions picked up in July, with a larger percentage of consumers saying they planned to purchase homes, automobiles, and major appliances in the coming months. Thus, consumer spending should continue to support robust economic growth in the second half of 2021.”
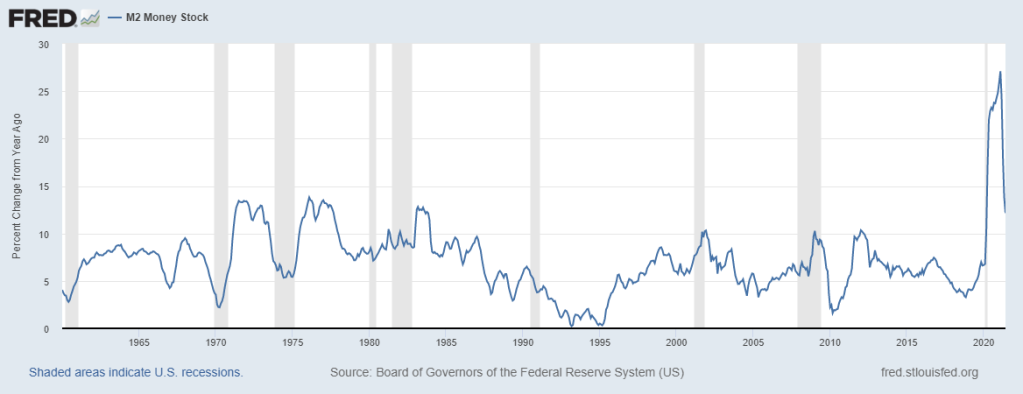
M2 level of money supply grew +0.1% in June, the annualized growth rate is now +12.2% (down from +13.9% last month). M2 annualized growth is still above the historical average of +7.1%, but well off the +27% highs of late last year and earlier this year.
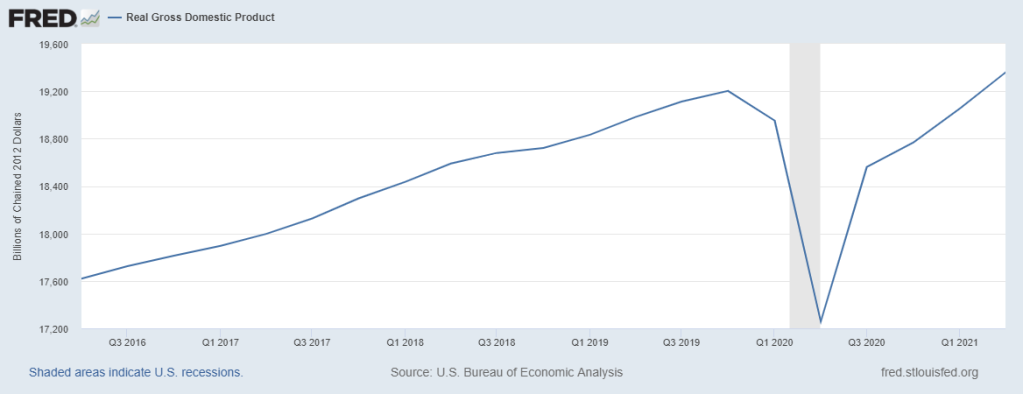
First estimate of 2nd Quarter Gross Domestic Product (GDP) showed a gain of annualized, at $19.358 trillion. Led by strength in consumer spending, which grew at an annualized rate of . The results were below the street estimate of +8.5%, but still high enough to surpass the pre-COVID high of $19.2 trillion in inflation adjusted dollars. The economy has now fully recovered from the COVID recession.
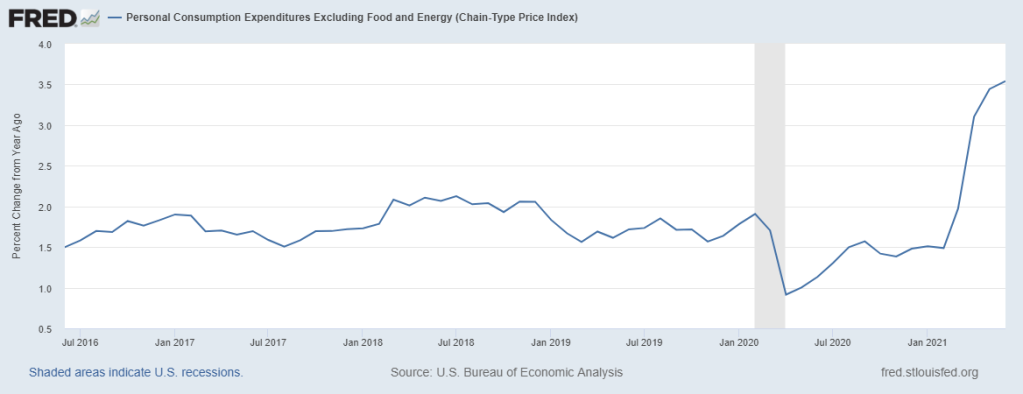
Personal Consumption Expenditures minus food & energy (Core PCE) increased in June. This puts the annualized PCE inflation rate at , up from 3.4% last month.
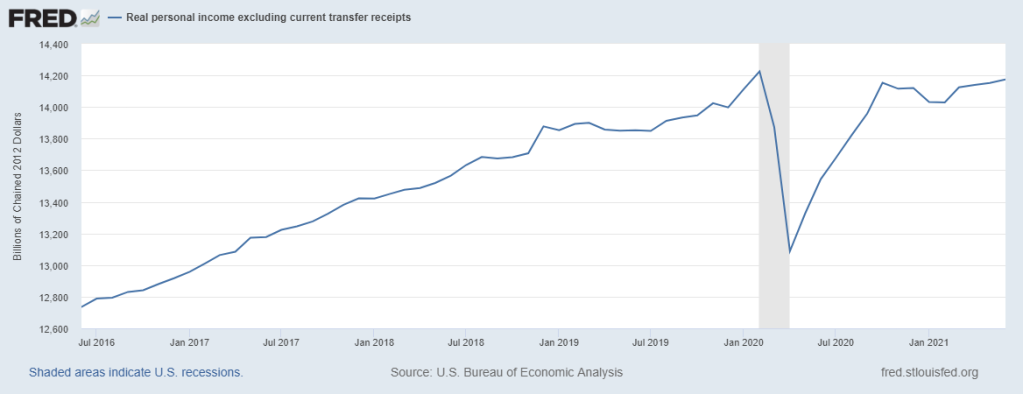
Personal incomes excluding transfer receipts rose in June, and +4.7% higher than June 2020 results.
Notable earnings
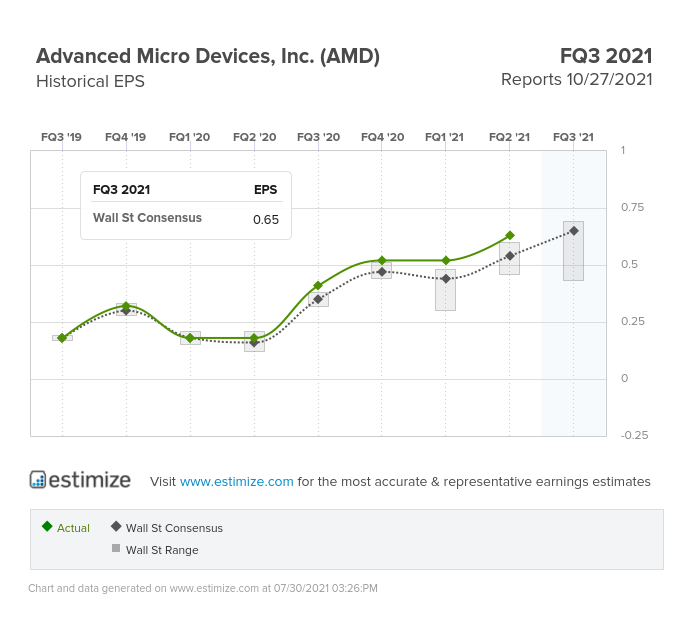
Advanced Micro Devices Inc (NASDAQ:) reported a phenomenal with solid gains across PC, server, and gaming segments. Adjusted EPS came in 17% above street expectations, for a year-over-year growth rate of 250%.
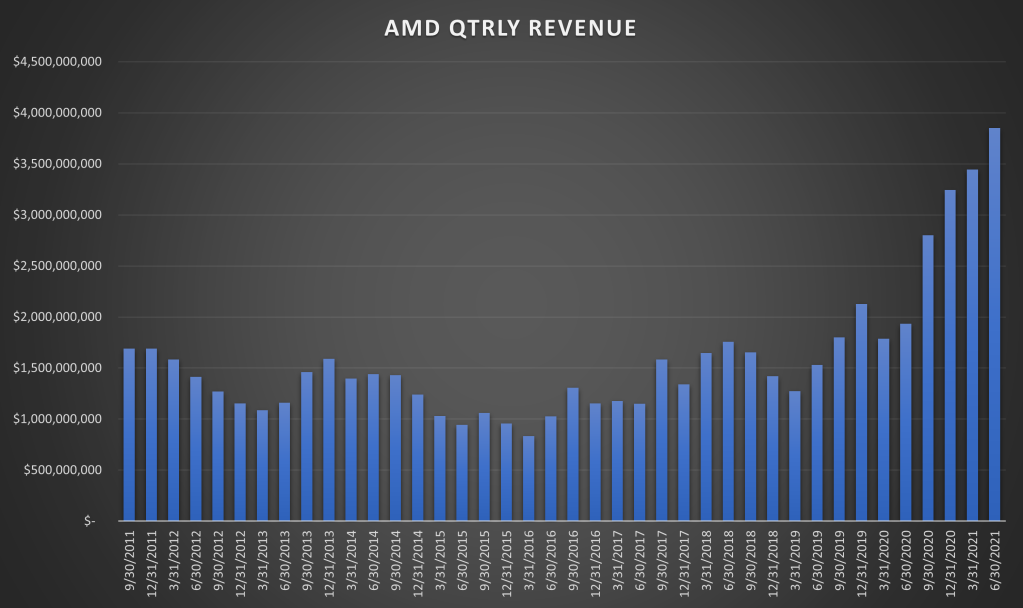
Quarterly revenues continue to break company records. Results came in 6.4% above street expectations, for a year-over-year growth rate of 99% (after a +92% growth rate last quarter), the highest growth rate in over 10 years.
Gross margins improved to 47.5%, while operating margins (21.5%) more than doubled from Q2 2020 results. Operating income grew 380%.
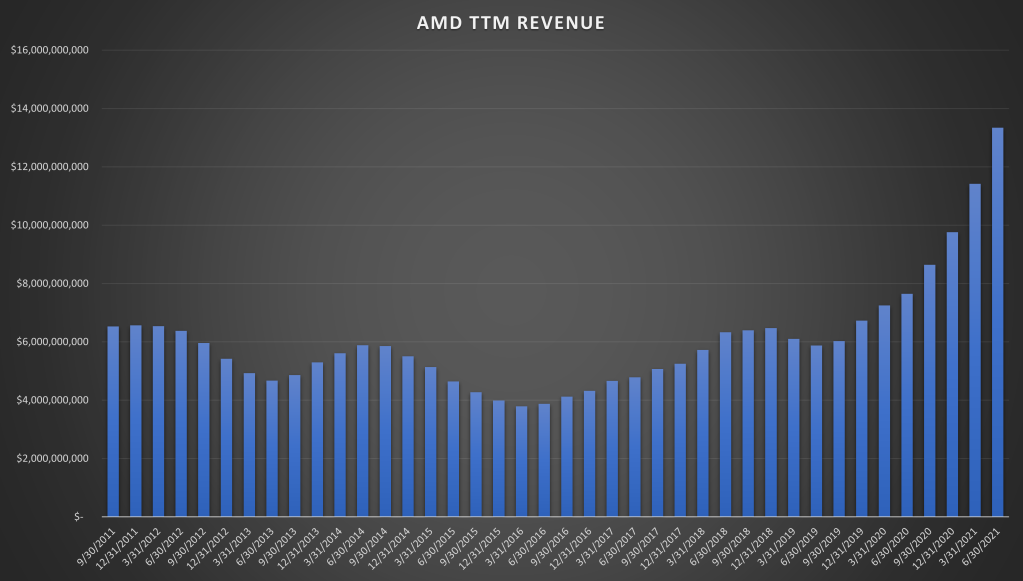
AMD has now reported $13.34 billion in revenues over the last 4 quarters. +75% higher than it was at this time last year, and +17% above last quarter.
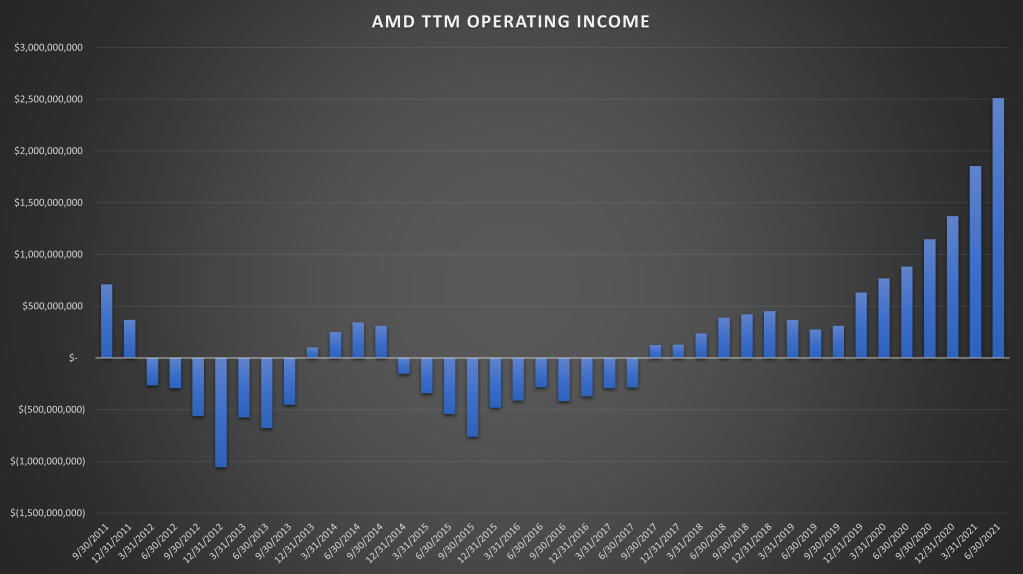
Operating income reported over the last 4 quarters (TTM) is now $2.5 billion. AMD has done an amazing job of transforming the company towards profitability and a serious competitor to Intel (NASDAQ:).
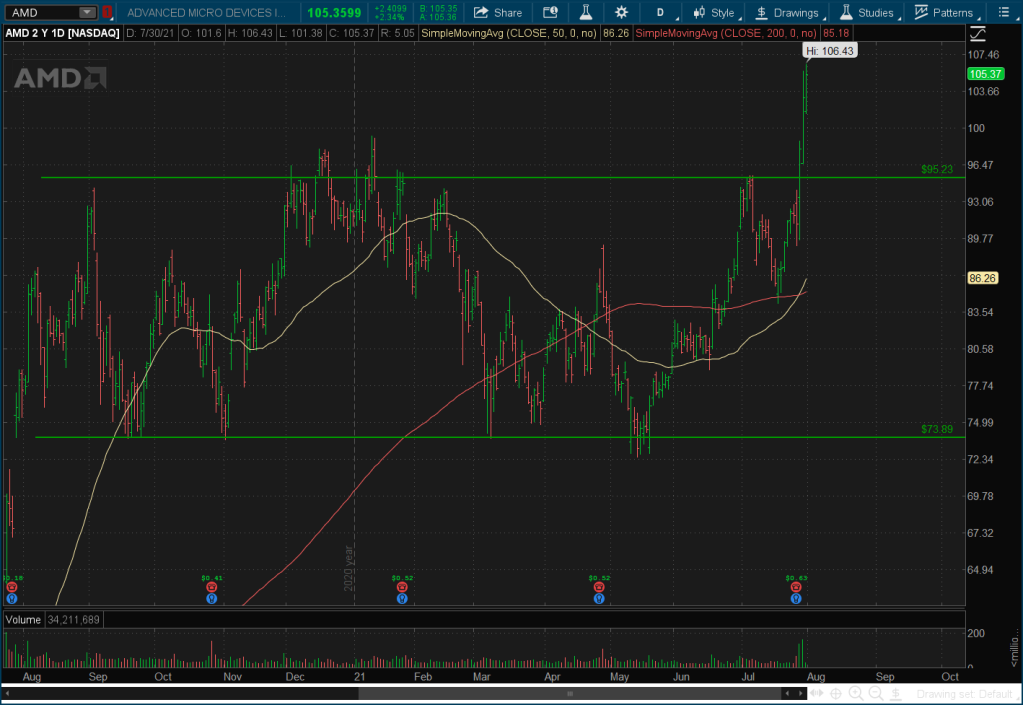
It was a great quarter all around. Not only did AMD crush expectations, they raised forward guidance and now see +60% revenue growth in 2021 (which may still be on the conservative side). As a result, the stock broke out of a 12 month trading range towards a new all time high. Maintain a full position in the stock with no intentions to sell.
Chart of the week
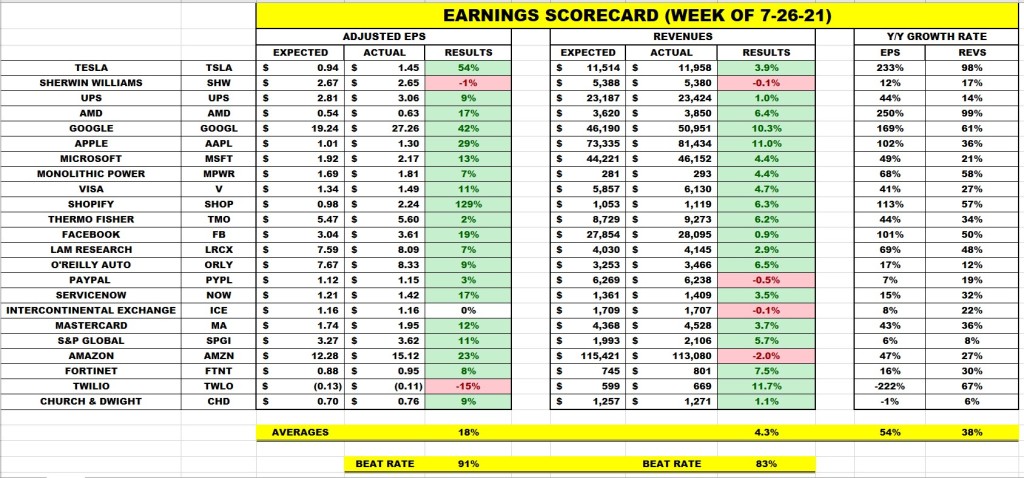
Last week was by far the busiest week of earnings, with about half the companies that are either in the portfolio or on the shopping list, reporting results. Not enough time to review them all here, so I put up the earnings scorecard for review.
91% beat their earnings estimates by an average of 18% above expectations, led by (NYSE:), (NASDAQ:), and (NASDAQ:).
83% beat revenue estimates by an average of 4.3% above estimates, led by (NYSE:), and (NASDAQ:).
Average year-over-year growth rate in EPS was +54%. Average year-over-year growth rate in revenue was +38%.
Summary
The majority of earnings and data continued to support a continued economic recovery. Progress on the infrastructure bill helped boost sentiment for the more cyclical sectors of the market like Industrials. That may offset some of the “peak growth” concerns in the technology space.
Apple, (NASDAQ:), and (NASDAQ:) all issued lower forward guidance, and (NASDAQ:) reported a rare miss on revenues along with guidance that fell short of street expectations.
Let’s put this in perspective though, even with the lower guidance, these companies still have growth rates most companies can only dream of. There wasn’t anything in the reports this past week that would cause me to sell any of the holdings. I would see any excessive dip as a buying opportunity if it were to occur.
I’m not sure we have ever seen a 5 quarter earnings streak like this; with a consistent 80%+ beat rate and results coming in between 15% to 22% above expectations. Q2 earnings growth rate of 89% is unlikely to be topped in a very long time (if ever), but Q3 and Q4 look likely to come in around +20%, and then may moderate significantly in the first half of 2022.
This week:
For economic data we have on Monday, on Wednesday, and the BLS employment report on Friday.
For earnings, we have 154 S&P 500 companies reporting. I’ll be paying attention to Booking Holdings (NASDAQ:)—formerly Priceline.com—and Uber (NYSE:) on Wednesday, and Square (NYSE:) on Thursday.


