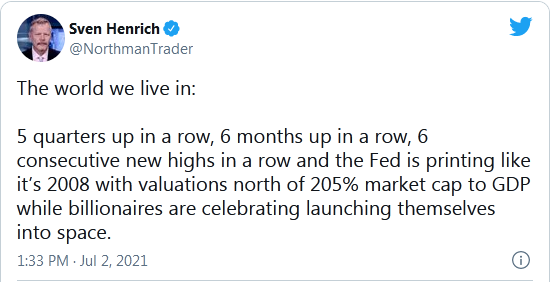
So they crushed the again as volatility has entirely disappeared and the never ending rally keeps on ticking high relentlessly.
Welcome to every big rally in recent years that all ended in a spanking in one form or another other. This rally of course the most liquidity drenched in history having seemingly vanquished all 2 way price discovery.
Tweet
Yet, because and despite of all this, the VIX patiently informs of another big spike to come. I’ve talked about this since the beginning of the year and followed up on the evolution of the structural VIX chart.
Most recently here:
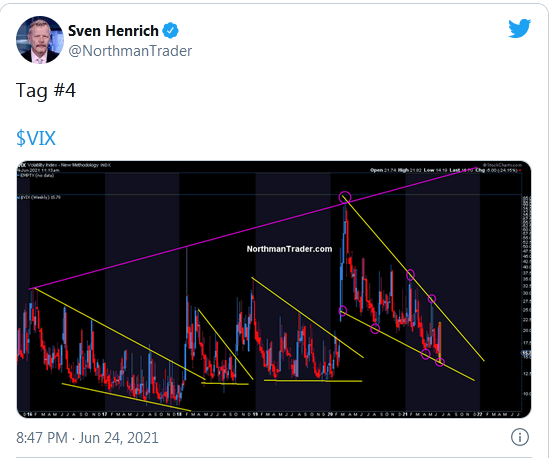
VIX Chart
Notably, despite the non stop rally in recent weeks, the structure keeps holding in an impressive fashion and in context this chart combination is notable:
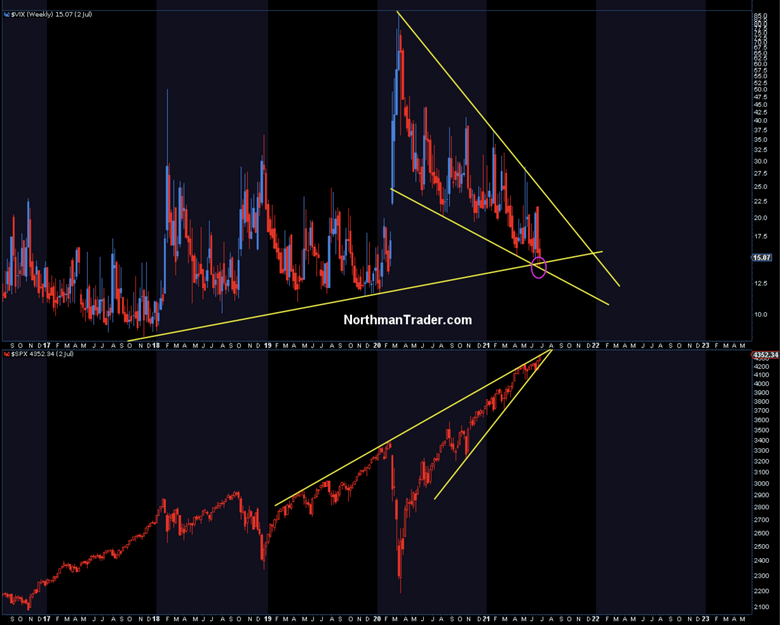
Not only does the falling wedge pattern continue to hold precisely, but for now even the uptrend from the 2017 lows is holding. Could it break lower? I suppose so, but note the VIX ratio has once again reached extreme low levels from which sizable volatility spikes have occurred in recent years now matching the lows we saw back in late 2017 early 2018:
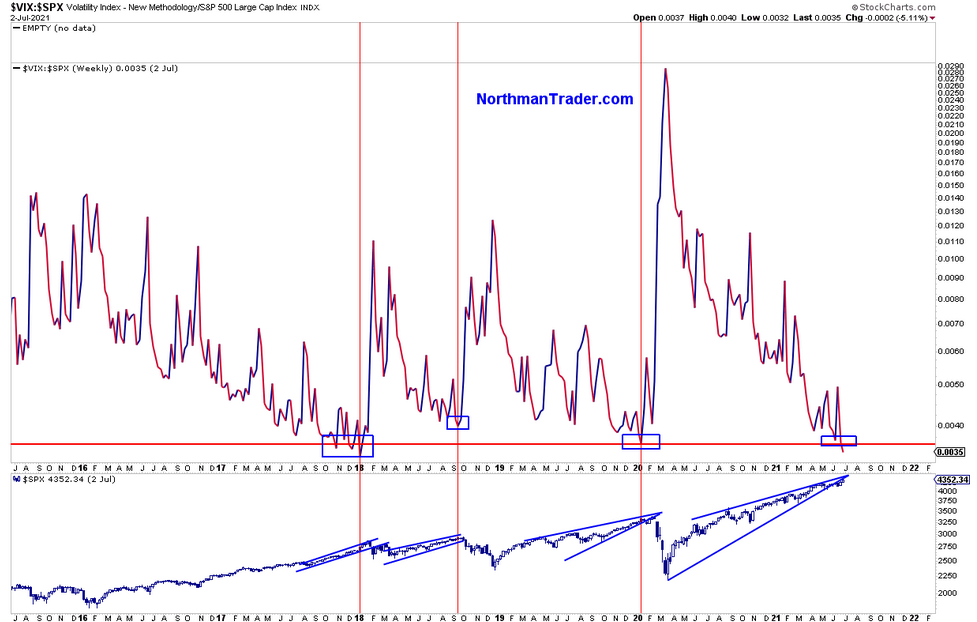
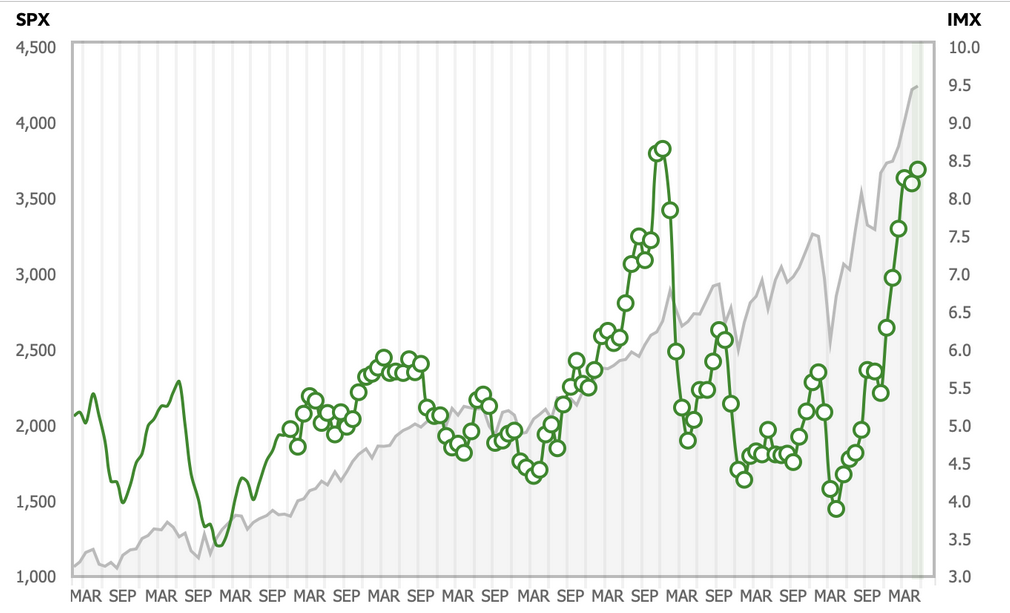
Fun fact: Investor flows appear to now be just as optimistic as then according to the Ameritrade IMX index:
Even on the daily VIX chart we see structure bubbling again:
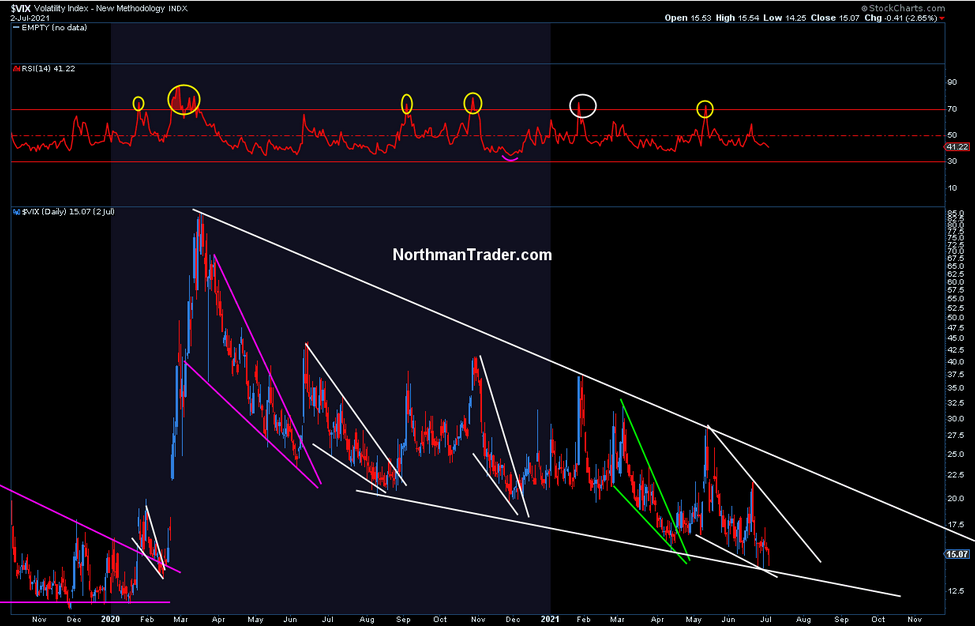
None of this unfortunately gives us the day and the time, but it informs us that another volatility spike will come, and perhaps first just another smaller one into the 20’s. But the larger structure continues to build very cleanly and it looks very powerful suggesting something much more sinister will come. 50? 60? 70? 100? Only time will tell.
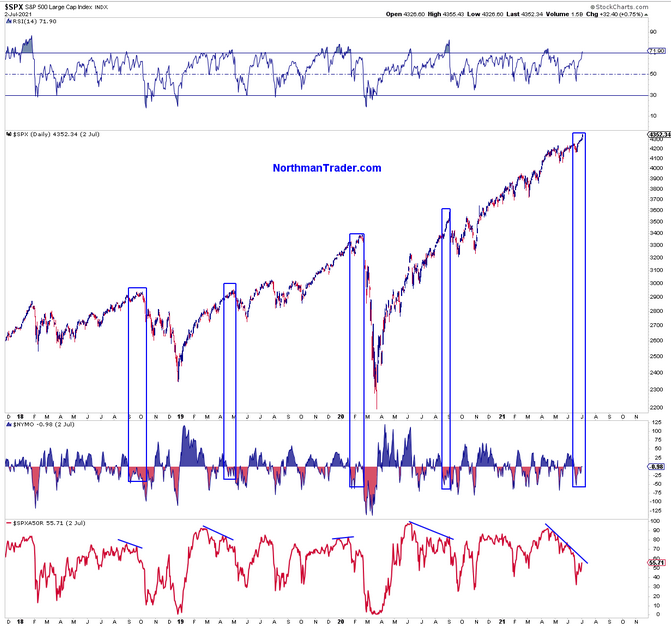
In the meantime the Fed continues to insist on exacerbating everything from asset bubbles to wealth inequality while the larger rally continues to weaken underneath as it has many times before a larger volatility spike has commenced:
For further detail please see the boarder market analysis I put out this weekend in Reality Check:
Fusion Media or anyone involved with Fusion Media will not accept any liability for loss or damage as a result of reliance on the information including data, quotes, charts and buy/sell signals contained within this website. Please be fully informed regarding the risks and costs associated with trading the financial markets, it is one of the riskiest investment forms possible.

