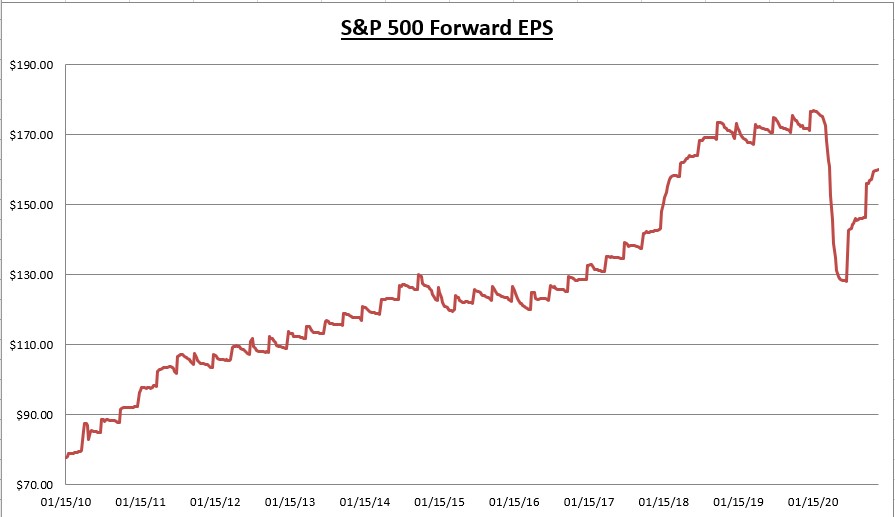
 S&P Forward Earnings
Last week the S&P 500 earnings per share rose from $159.89 to $160.08 and the S&P 500 index rose 2.27%.
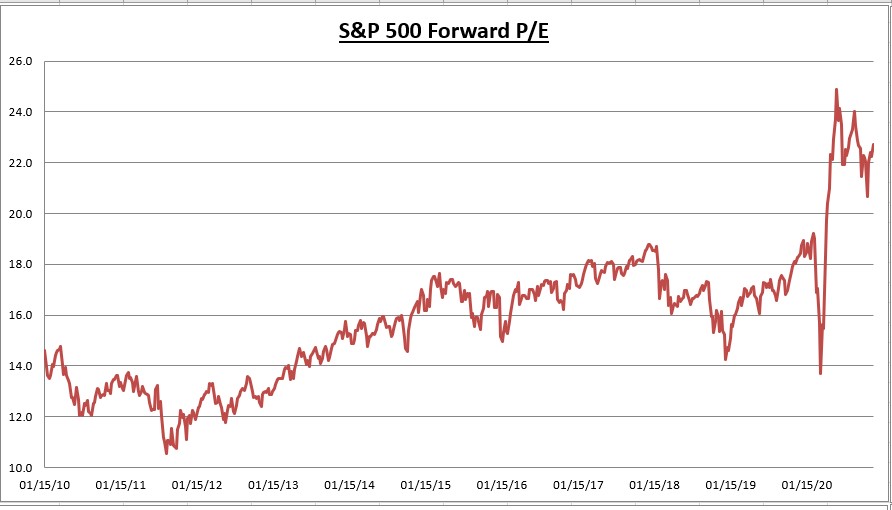 S&P Forward PE
Because the index increased by more than the increase in the EPS, the price to earnings ratio increased to 22.7x. A higher PE means stocks are more expensive on a valuation basis.
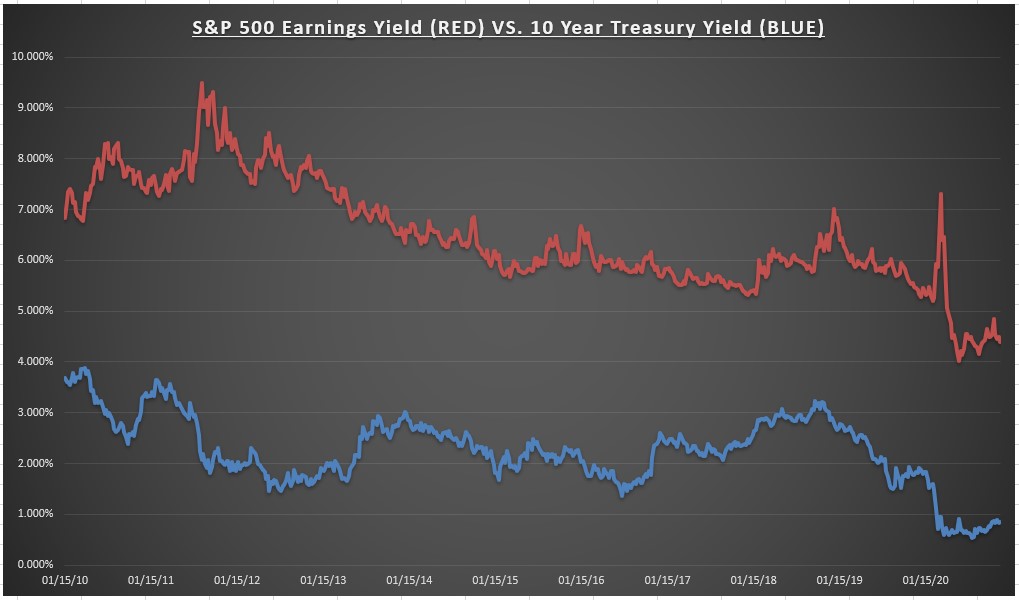 S&P Earnings Yield
The earnings yield on the S&P 500 now stands at 4.40%. And while the 10-year treasury bond rate rose from 0.83% to 0.84% last week, the equity risk premium still has stocks the clear winner.
Annual earnings growth projections now stand at:
- 2020: -15.5%
- 2021: +22.4%
- 2022: +16.36%
At this pace, a new all time high in EPS is projected to come in sometime in the 1st half of 2021. Which would be a record earnings recovery from past recessions (it took 5 years to make a new high in EPS after the 2008 recession).
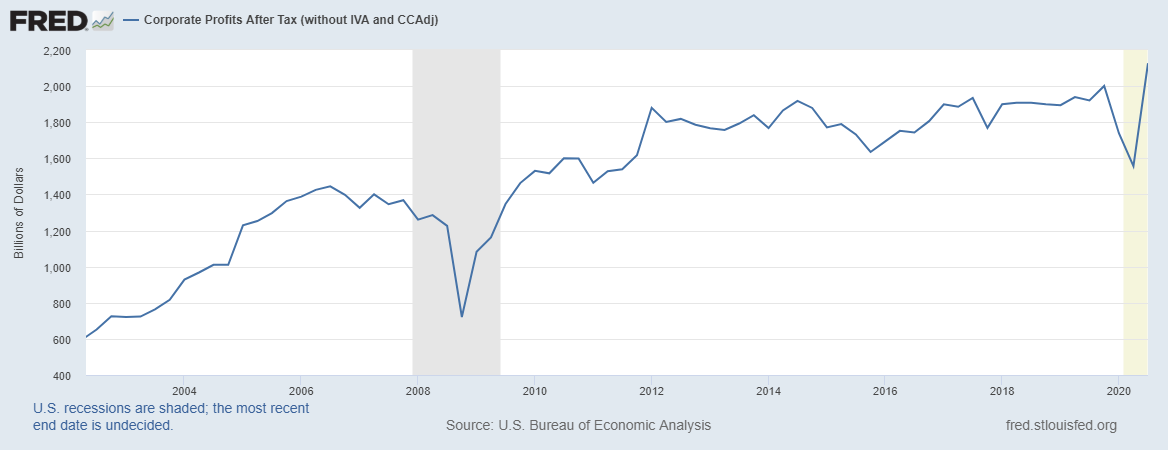 Corporate ProfitsWhile the S&P 500 EPS is still below its pre-COVID highs, corporate profits for all US based companies soared to a new all time high in Q3; coming in at over $2.1 billion.
In fact, with all time high corporate profits and historically low interest rates, there is a case to be made that stocks are still undervalued, even though the major averages have made all time highs.
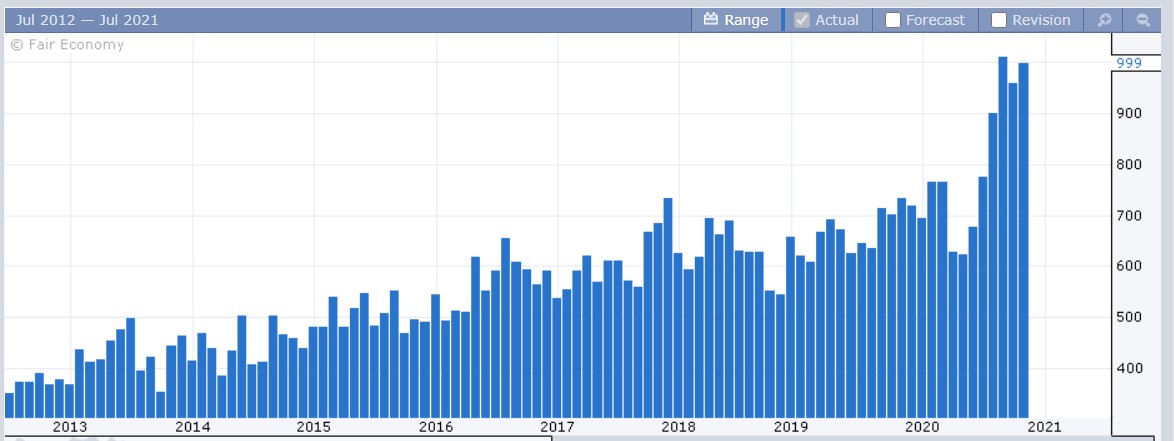 New Home SalesNew home sales numbers continue to impress. 999K is a tick below the prior month, because last months numbers were revised higher by 43,000 (from 959K to 1002K). Don’t let that fool you, you have to go back to January 2007 to see new home sales numbers this high.
The economy grew a record 33% in GDP for Q3, and November is shaping up to be one of the best months for the stock market in 33 years. We are 2/3rds of the way through Q4, and the latest GDPNow estimates from the Atlanta Fed now project Q4 economic growth of 11%. Adobe (NASDAQ:ADBE) Analytics announced that Thanksgiving day spending rose 22% year over year to $5.1 billion.
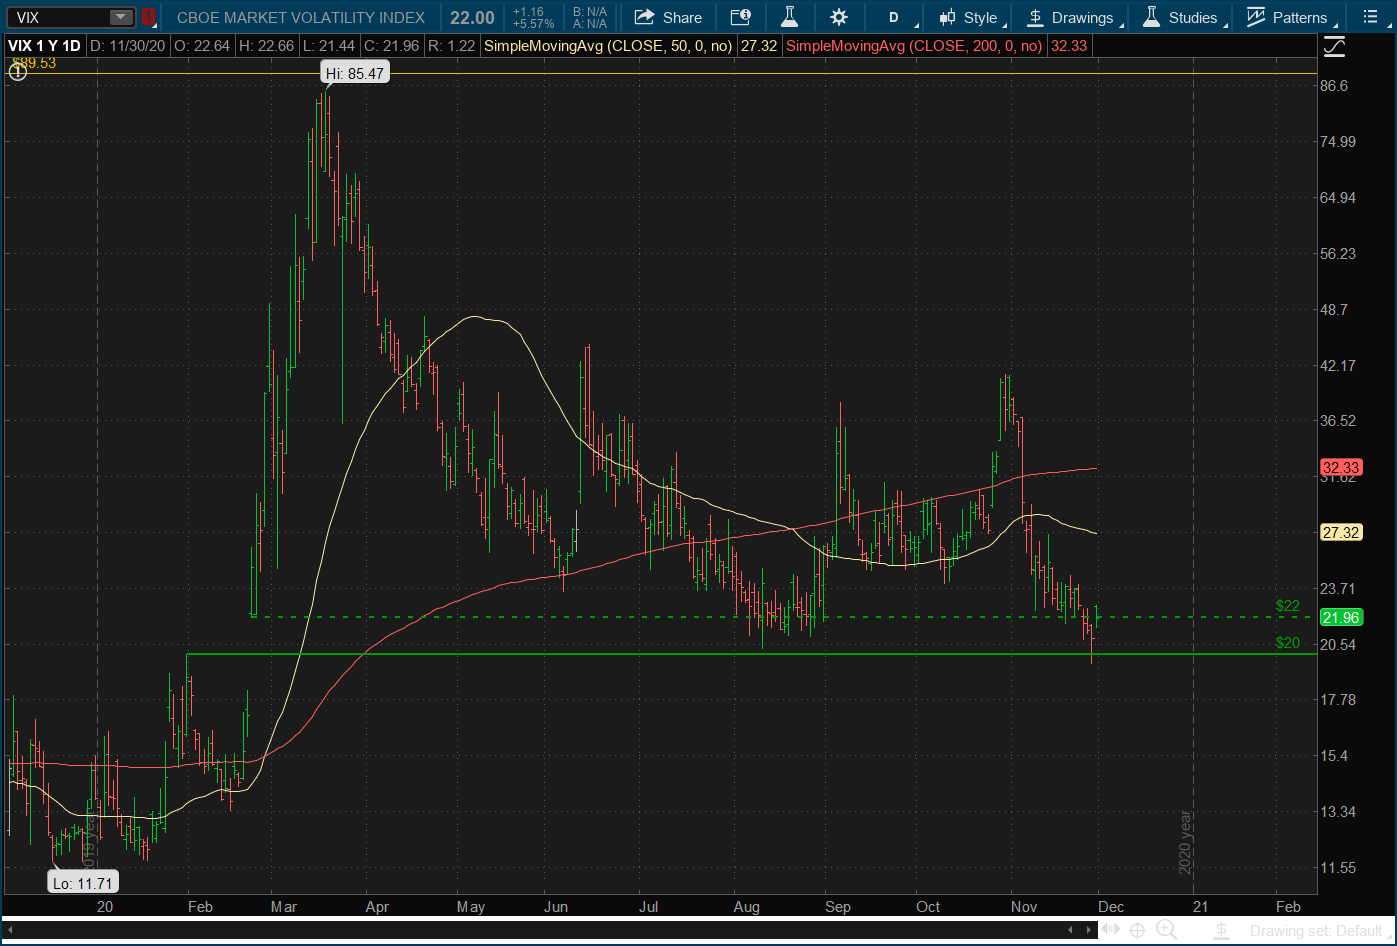 VIX DailyAs a result, the “fear trade” is beginning to be unwound. Gold is down 15% from its recent highs, the 10 year treasury bond rate (although still low) is up from the 0.398% level it briefly traded at at the height of the March panic.
The volatility index (VIX) – chart above – during the March selloff in stocks, almost traded above the highs of the 2008 financial crisis. That index is well off those highs, and briefly traded below 20 on Friday, but still clearly above the pre-COVID low levels.
20 is a technically significant level in my opinion. Most bull market advances occur with the VIX trading below 20. A VIX in the 20 – 40 range is more of a traders market with increased volatility. And a VIX at 40+ is dangerous.
I suspect we won’t see a VIX stay below 20 while the threat of more ridiculous lockdowns is still upon us. It’s probably the biggest near term threat. EPS projections would be highly unreliable should such an event occur again.
This week we’ve got some key economic data points like ISM Services & Manufacturing and the jobs report. We’ve also got some key earnings for the software stocks that have done so well this year. The ones I’ll be paying special attention to are:
- Zoom Video Communications(NASDAQ:ZM)
- Salesforce (NYSE:CRM)
- Crowdstrike (NASDAQ:CRWD)
- Zscaler (NASDAQ:ZS)
- DocuSign (NASDAQ:DOCU)
- Veeva Systems (NYSE:VEEV)
I own them all and have actually reduced positions in all of them except VEEV recently. They have all had such great runs this year, I figured its time to start looking to allocate some money to the “reopening” trade, since the markets are always looking 6-12 months in advance.
Stay the course but buckle up for the next few months.
Leave a comment