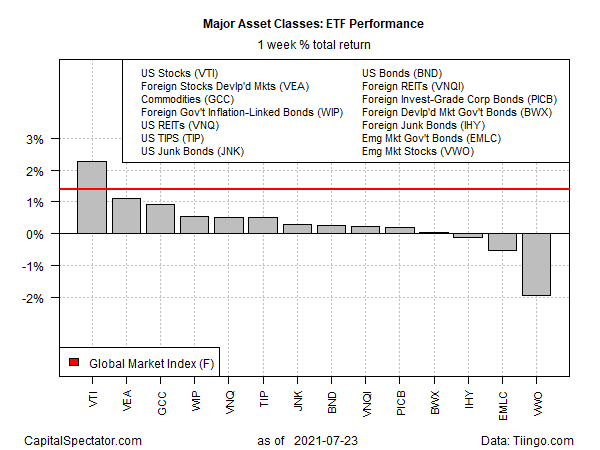
American shares recovered with a strong gain for the trading week through Friday, July 23, posting the highest increase for the , based on a set of exchange traded funds.
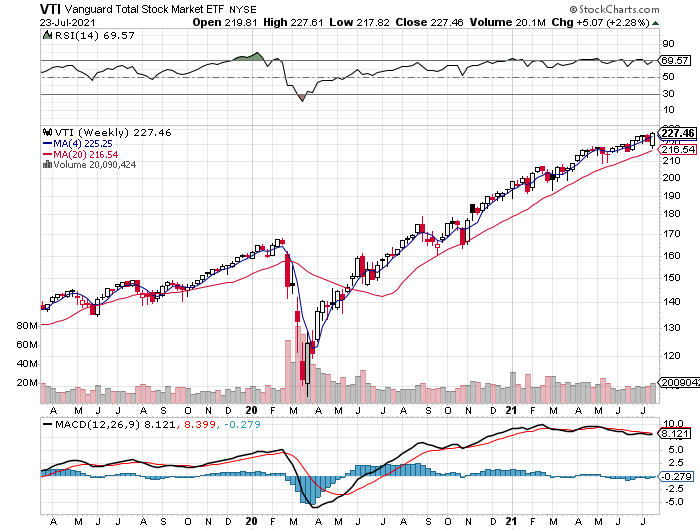
Vanguard Total Stock Market Index Fund ETF Shares (NYSE:) rallied 2.3% last week, recovering all the losses in the previous week and then some. By the end of Friday’s trading, VTI settled at a new record high.

At the other extreme, stocks in emerging markets suffered the deepest decline for the major asset classes last week. Vanguard FTSE Emerging Markets Index Fund ETF Shares (NYSE:) fell 1.9%, dropping to the lowest close in over two months.
The combination of slowing growth in China and a strengthening are headwinds for emerging markets stocks, say analysts.
Measuring how all the major assets performed as one strategy reflects a solid gain last week. An ETF-based version of the Global Market Index (GMI.F) rose 1.4%—the best weekly gain in a month. This unmanaged benchmark (maintained by CapitalSpectator.com) holds all the major asset classes (except cash) in market-value weights via ETF proxies.

ETF Performance Weekly Returns
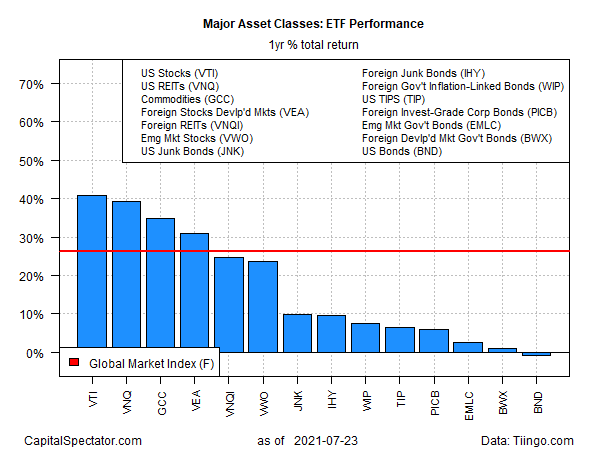
For the one-year window, US stocks continue to lead, if only slightly. VTI is up 40.7% on a total-return basis over the past 12 months. That’s modestly ahead of the second-best one-year performer: Vanguard Real Estate Index Fund ETF Shares (NYSE:), which is up 39.3% over the past year.
US investment-grade bonds remain the only one-year loser for the major asset classes. Vanguard Total Bond Market Index Fund ETF Shares (NASDAQ:) is off 0.8% for the past year, even after factoring in distributions.
GMI.F’s one-year gain is a strong 26.1%.

ETF Performance Yearly Returns
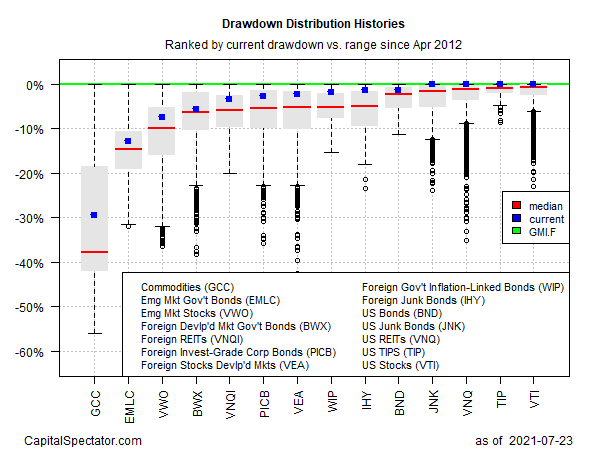
Ranking the major asset classes via current drawdown still shows that most of our proxy ETFs currently enjoy peak-to-trough declines of no more than -5%. US stocks (VTI) are the current leader for this metric via a 0% peak-to-trough decline as of Friday’s close. Meanwhile, commodities () are posting the deepest drawdown: nearly -30%.
GMI.F, by contrast, is at a record high and so the benchmark’s peak-to-trough decline is currently zero.

Drawdown Distribution Histories

