Earlier this month I a model for estimating the US stock market’s return in the decade ahead. The post is part of a larger goal is to develop several models and use the average as more reliable forecast, based on the empirical evidence that combining models tends to generate superior results vs. any one model. In addition, the focus on equities is the counterpart to a on estimating “fair value” for the Treasury yield.
Today’s update focuses on the Excess CAPE Yield (ECY), defined by Professor Robert Shiller. The idea is to adjust the an equity market valuation metric — cyclically adjusted price-to-earnings (CAPE) ratio — via interest rates.
“The level of interest rates is an increasingly important element to consider when valuing equities,” Shiller explains. “To capture these effects and compare investments in stocks versus bonds, we developed the ECY, which considers both equity valuation and interest-rate levels. To calculate the ECY, we simply invert the CAPE ratio to get a yield and then subtract the ten-year real interest rate.” (The raw data for CAPE and ECY are available at Shiller’s website.)
In the first installment for projecting equity returns I used CAPE as a predictor. The related model forecasts a 10-year return that’s quite low, perhaps 1% to 2% a year if you put an optimistic spin on the results. That compares with a trailing 10-year return for the S&P 500 of 12.6% (through yesterday, July 20). The sharply reduced return outlook is a function of an unusually high CAPE ratio, which suggests that stocks are highly valued and therefore unlikely to generate performance over the next decade that’s anywhere close to the past ten years.
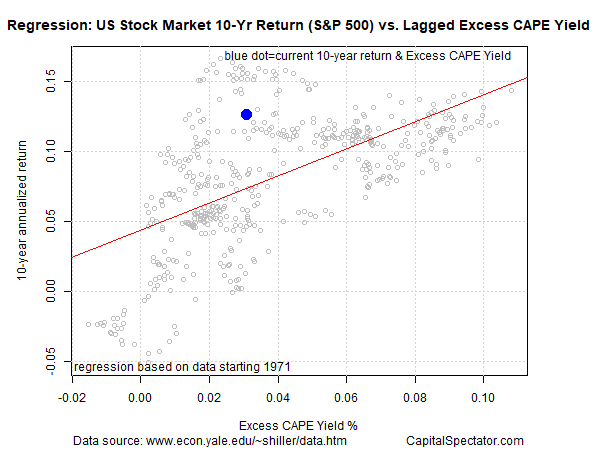
Adjusting CAPE for the unusually low level of interest rates, on the other hand, dispenses a higher expected return – roughly 7%, as implied by the regression chart below.

US Stock Mkt 10 Yr Return Vs CAPE Yield
The main takeaway: factoring in a 10-year Treasury rate that’s modestly negative in real terms implies a higher equity return vs. the standard CAPE metric, which focuses only on equity market valuation.
Which model is correct? Both are almost certainly wrong in some degree. Par for the course with models that attempt to divine the future. At the same time, each model offers useful if flawed information. The two together are even better, at least in theory. Assuming the CAPE model projects a 1% return and ECY anticipates 7% gives an average forecast of 4%.
Can we do better? Probably, by adding more forecasts to the mix and using the average as a relatively robust estimate.
In a future post I’ll add another model to the mix in part three, this time looking in a different direction from Shiller’s CAPE and ECY metrics. To the extent that combining forecasts is productive, the process depends on using estimates drawn from models that make different assumptions and draw on different data sets. Diversification, in short, is a powerful force in forecasting, just as it is in asset allocation.

