Volatility
The volatility in the equity market has picked up rather dramatically over the past couple of days, with markets falling sharply on Friday and Monday and rebounding Tuesday and Wednesday sharply. In the end, not much has been accomplished.
Much of this was expected, as the markets were overbought on an index and individual stock level last week. Additionally, gamma levels reset with the expiration on Friday. None of this should have come as a surprise to anyone.
The question we always ask is, what happens now? It is a tricky one to answer as I think the market is in the midst of transitioning. There is hardly anyone talking about this, but it is clear that something is changing in the market, given the changes in breadth and leadership.
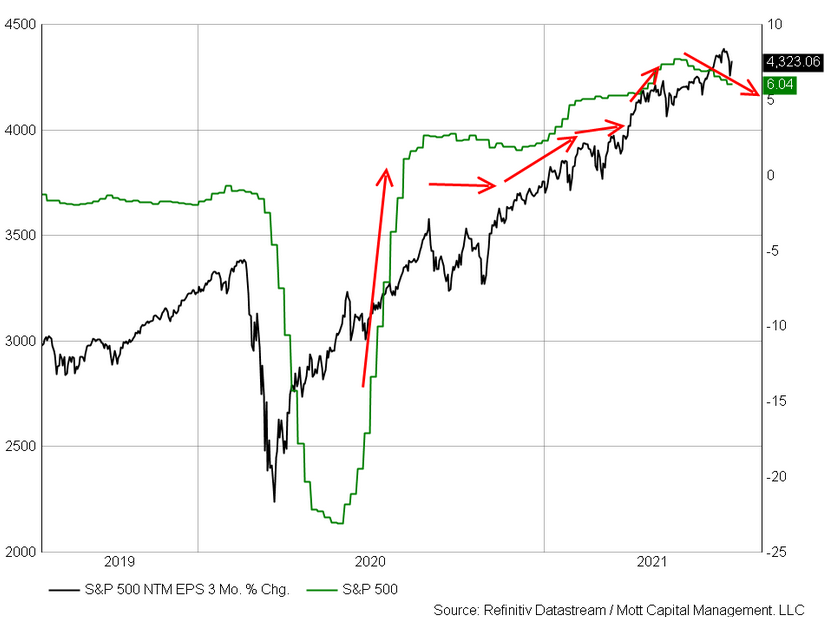
Perhaps this chart illustrates it the best: the 3-month change in the 12-month forward EPS estimates for the . The market anticipates changes in EPS growth rates and has successfully done that since the March 2020 lows.
However, if you notice, that has changed in recent weeks, and the trend in the growth rate is now sloping lower. If the market is transitioning to a slower growth rate in the future, then it would seem to suggest that the PE multiple should contract and that the current path of the market is to follow that growth rate down.
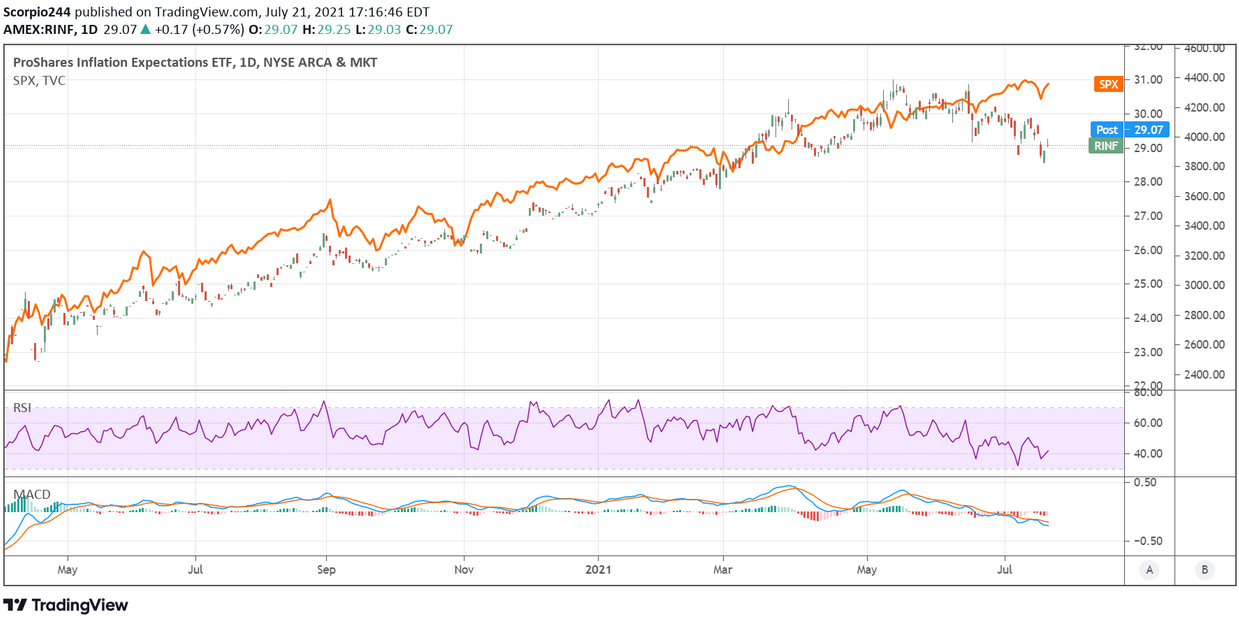
This is not the only thing that is diverging; of course, we have been tracking the divergence between the breakeven inflation expectations and the S&P 500, and that message tells that slower growth lies ahead for the market.
S&P 500 EW
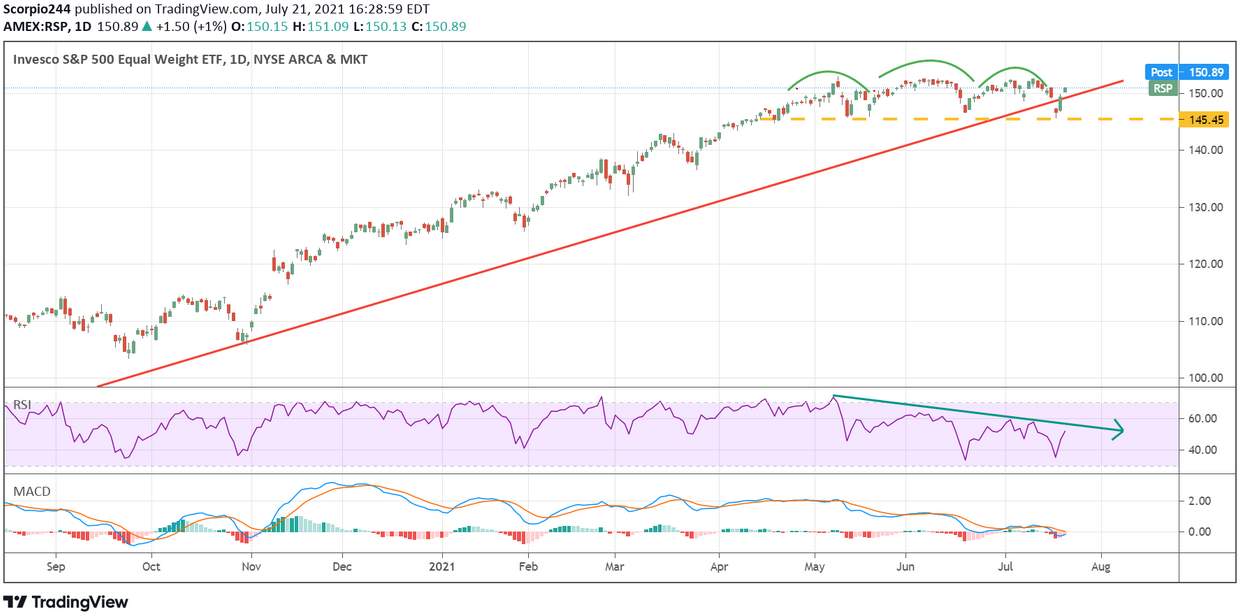
The Invesco S&P 500® Equal Weight ETF (MX:) was a lot of our focus until Wednesday, and it remains in our focus. The RSP has managed to find some key support at the $145.45 level, which was highlighted as support at some point last week. The momentum for the RSP is very negative, and it appears that those negative trends are still a force based on the MACD and the RSI.
Financials
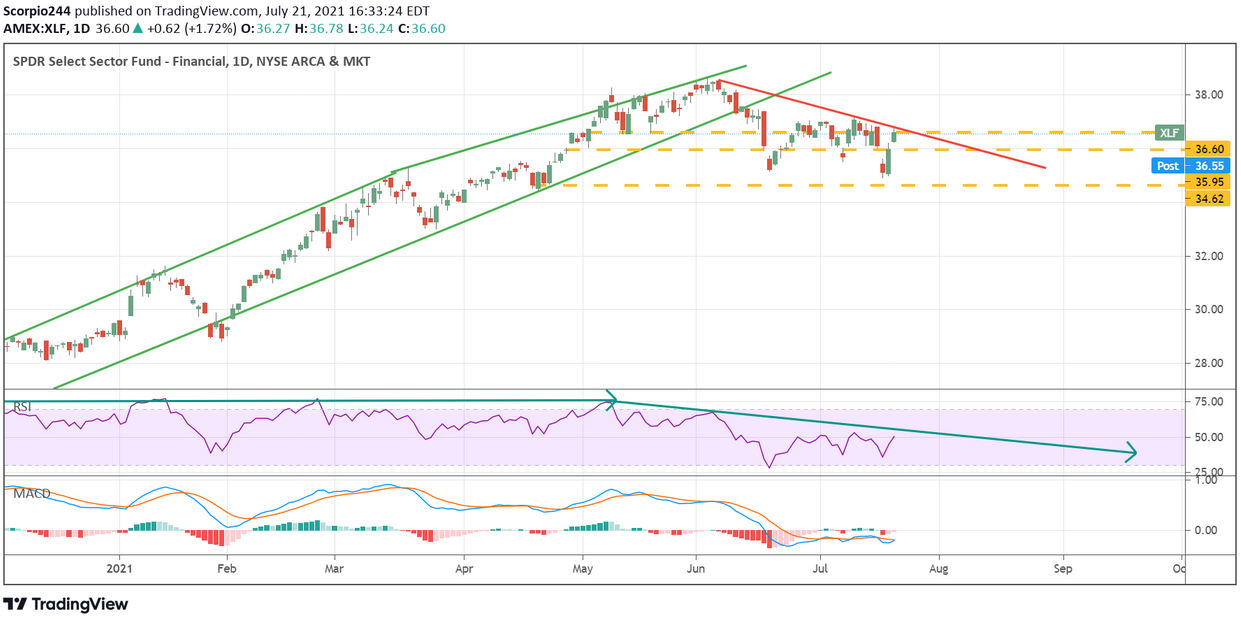
One reason why the S&P 500 has been able to bounce back so quickly is that after falling sharply, yields have moved higher again, which has at least helped lift the reflation trade. The Financial Select Sector SPDR® Fund (NYSE:) has responded strongly, but finds itself in no better position on Wednesday than last week, with a negative sloping RSI and overall downtrend on the price level.
Yields
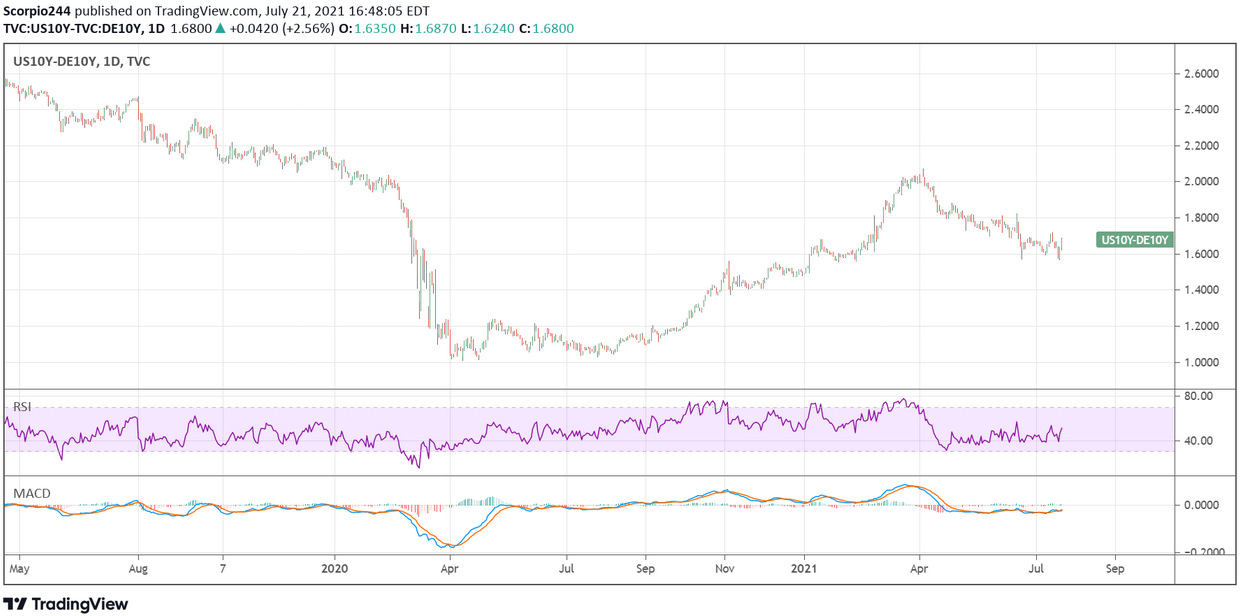
However, it seems unsure to me that yields here in the US will continue to rise. Today is the ECB , and I expect that the ECB will continue its very dovish , if not become even more dovish to help weaken the .
Overall, the dovish policy of the ECB is what is driving rates across Europe lower, and in turn dragging down US treasury rates too. As long as US rates continue to fall on the long-end, and remain higher on the short-end due to a Fed taper risk, then spreads shall continue to contract, which will continue to send a risk-off message to equity markets.
Be aware that the ECB announcement will be significant as to how the bond markets respond. If yields in Europe start dropping, it will drag US rates down and push the higher, which could very quickly reverse the equity rebound of the past 2 days.
