Our about Tesla (NASDAQ:) stock called for a surge to ~$600, followed by a major bearish reversal. We thought TSLA was then rising in wave 5. A new all-time high was supposed to occur, but since fifth waves conclude every impulse, we opined the bears would be eager to return. Besides, we couldn’t possibly justify the company’s valuation.
And indeed, a notable bearish reversal did occur, but not before the stock reached $900 a share in January, 2021. So, obviously the extension of the fifth wave ruined our timing. The exact length of a wave is impossible to predict, which is precisely why we always caution against picking tops and bottoms.
Currently in the vicinity of $650, Tesla is still extremely expensive by any fundamental measure. Alas, human beings are biased creatures. Present us with an even higher price and suddenly the expensive starts to look cheap. Unfortunately for Tesla bulls, the decline from $900 seems to be the start of something bigger.

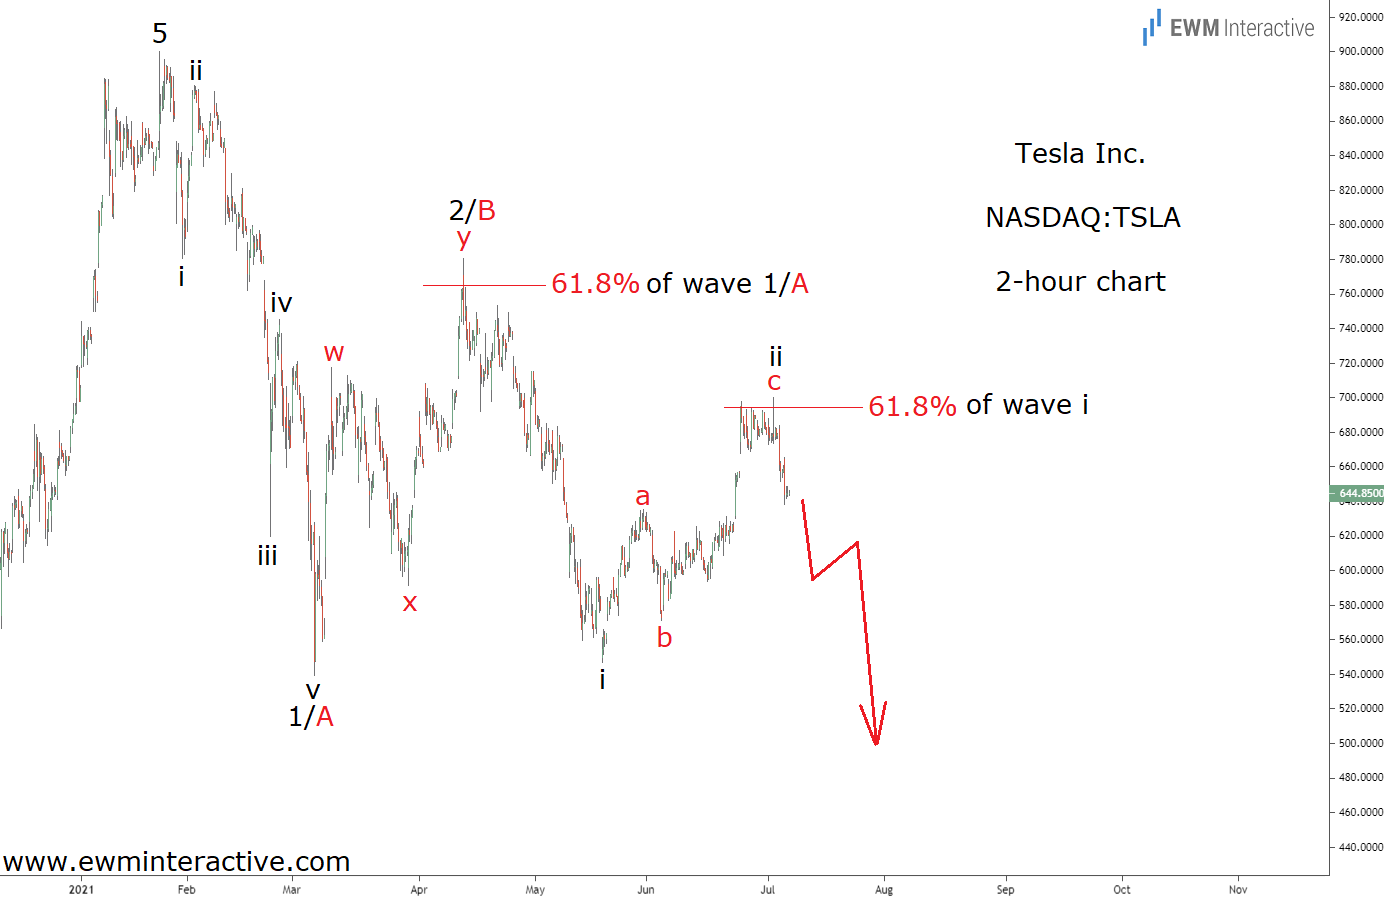
This 2-hour chart reveals that the drop to $540 has a clear impulsive structure. The pattern is labeled i-ii-iii-iv-v in wave 1/A, indicating that the larger trend is now pointing south. It was followed by a w-x-y double zigzag in wave 2/B up to the 61.8% Fibonacci resistance level.
The rest of the chart must then be visualizing waves i and ii of 3/C. Note that wave ii also retraced back to the 61.8% level of wave i. If this Elliott Wave count is correct, wave iii of 3/C can be expected to drag Tesla much lower from here. The bubble seems to be finally bursting. The bears remain in charge as long as the stock trades below the top of wave 2/B at $781.
Fusion Media or anyone involved with Fusion Media will not accept any liability for loss or damage as a result of reliance on the information including data, quotes, charts and buy/sell signals contained within this website. Please be fully informed regarding the risks and costs associated with trading the financial markets, it is one of the riskiest investment forms possible.

