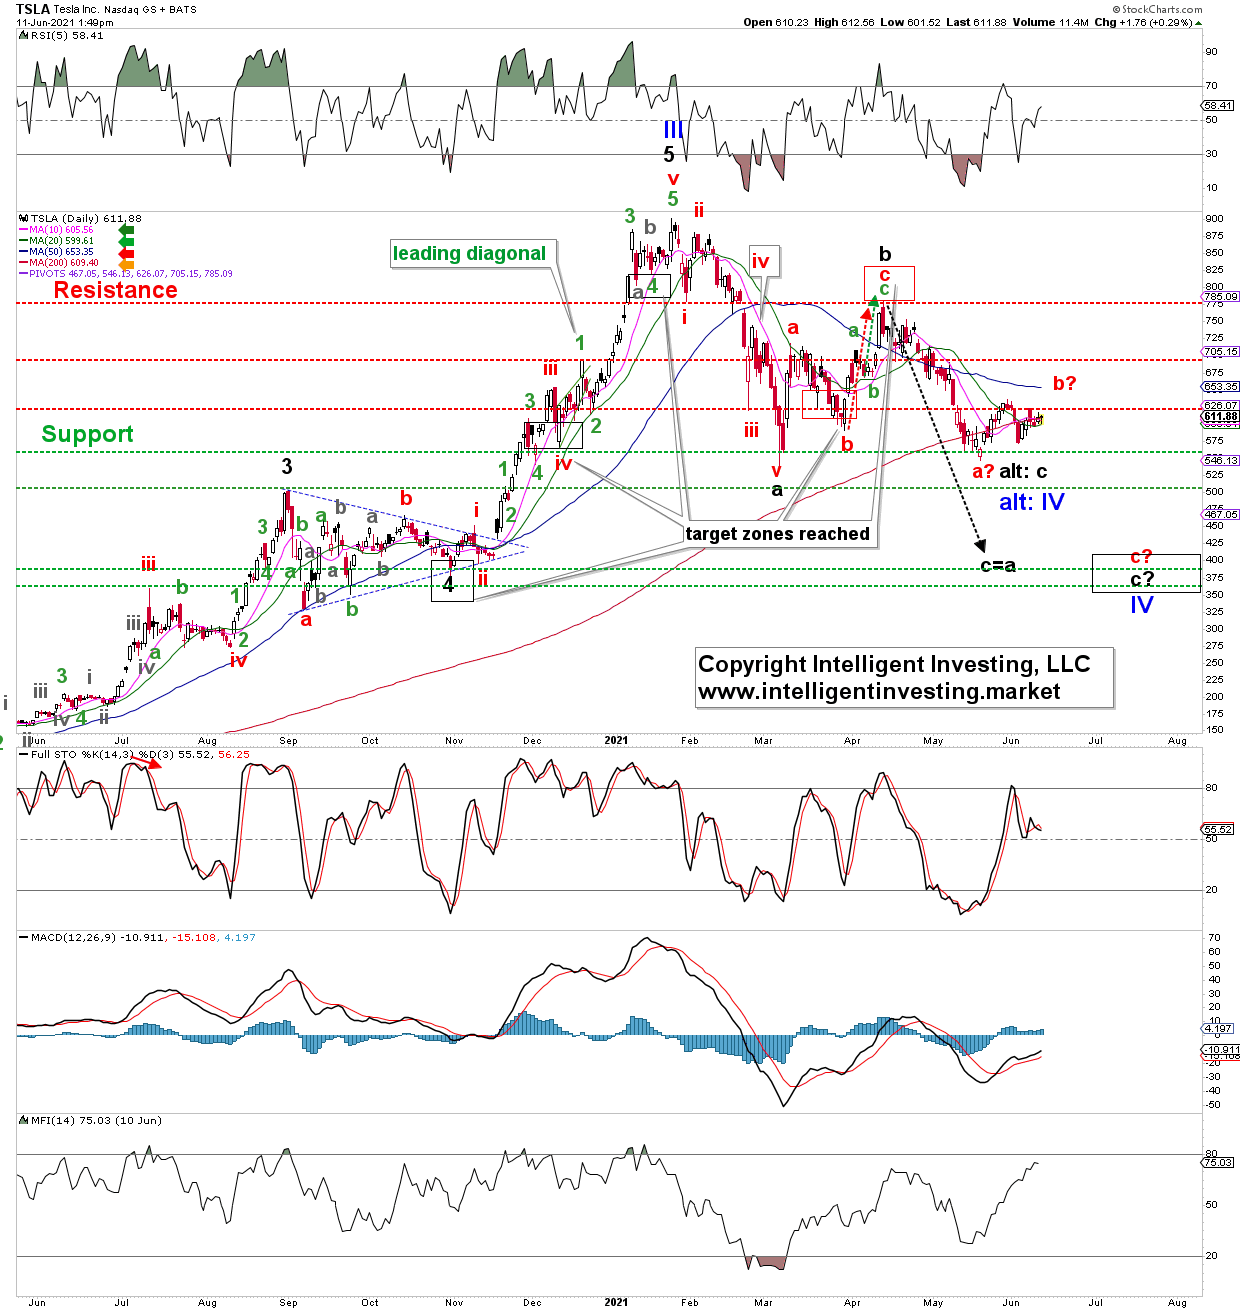
It has been a month since I last provided an update on Tesla’s (NASDAQ:) share price. Back then, it was trading at around $575. Now, it is trading at $610, a 6% gain in a month. That is not much to write home about, nor much that helps me constructively assess the next most likely move. Besides, while the and the are close to their all-time highs, albeit having been range-bound since February this year, Tesla is still down 33% from its January all-time high. Thus, it is underperforming these two major indexes, not to mention in comparison to the and , which have set fresh all-time highs almost daily. Thus, all Tesla has done so far is gyrate around its 200-day simple moving average (SMA) over the last month. See Figure 1 below.
If it can stay above the 200-day SMA, all things are good. But the fact it has been struggling and not seen a “one-touch-and-go” setup is a sign of concern.
Figure 1. TSLA daily candlestick charts with EWP Count and Technical Indicators
Besides, Tesla is below its declining 50-day SMA. And it is evident from Figure 1 that “good times are ahead” when it trades above its rising 50-day SMA, and “bad times are ahead” when it trades below it.
Moreover, since my last update, the EWP suggests the rally is corrective and should fail due to the somewhat overlapping price action since my last update. A daily close below the 200-day SMA and $550 horizontal support can then help usher in the preferred decline to the ideal target zone, as shown in Figure 1.
But the bulls need to crack $625 resistance and rally Tesla back above the 50-day SMA to suggest the alternate EWP count is operable, i.e., blue primary wave-IV completed with a shorter than usual c-wave. Thus, we have explicit “if/then” scenarios ready to deploy when triggered, and we are prepared for either direction the price decides to take.
Fusion Media or anyone involved with Fusion Media will not accept any liability for loss or damage as a result of reliance on the information including data, quotes, charts and buy/sell signals contained within this website. Please be fully informed regarding the risks and costs associated with trading the financial markets, it is one of the riskiest investment forms possible.


