Despite the recent correction in the markets, leading to a hedge fund imploding, investors remain exuberant. The hopes for more stimulus, government spending, and Fed liquidity displace fears of a correction.
Before we get into the technical review of the markets, I thought Jason Zweig summed up the current environment well.
“This isn’t a bull market or a bear market. It’s a know-nothing market. Bragging rights used to go to those investors who worked the hardest at learning the most. Now the glory often goes to those who know the least and don’t even care.
“‘I don’t know what the f— I’m doing,’ a young man said in a TikTok video in January. ‘I just know I’m making money.’ He added that he’d been trading stocks for only three days, but ‘just like that, made $300 for the day.’ In the next few weeks that young man, Danny Tran, racked up roughly 500,000 followers on TikTok.”
That is the new investing world we live in. A world where individuals are getting investing “expertise” from young individuals on social media with huge followings. It is effectively the “blind leading the blind.”
Is there a risk to investing? Absolutely.
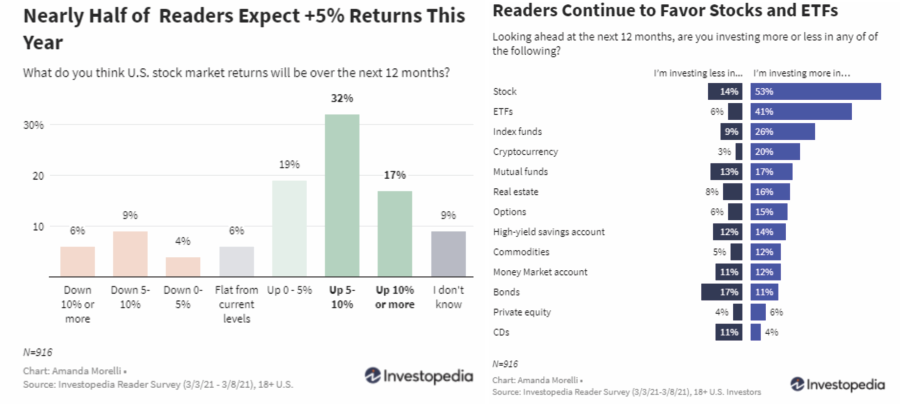
But investors have been trained by the Federal Reserve to “buy the dips.” Importantly, even as valuations stretch suggesting lower future returns, investors continue to expect above-average results. Such was the result of a recent Investopedia investor poll with readings expecting 5% or more and stocks and ETF’s over other asset classes.
In other words, it’s a “risk-on” market, baby!
Bull Markets Forgive Bad Mistakes
As Howard Marks noted in a recent Barron’s interview:
“Fear of missing out has taken over from the fear of losing money. If people are risk-tolerant and afraid of being out of the market, they buy aggressively, in which case you can’t find any bargains. That’s where we are now. That’s what the Fed engineered by putting rates at zero.”
As is often the case, investors tend to pile into markets when the risk versus reward is out of their favor. However, during a raging bull market, investors are forgiven for buying fundamentally unsound companies. Currently, the number of “unprofitable” companies is at the highest level since the dot.com era.
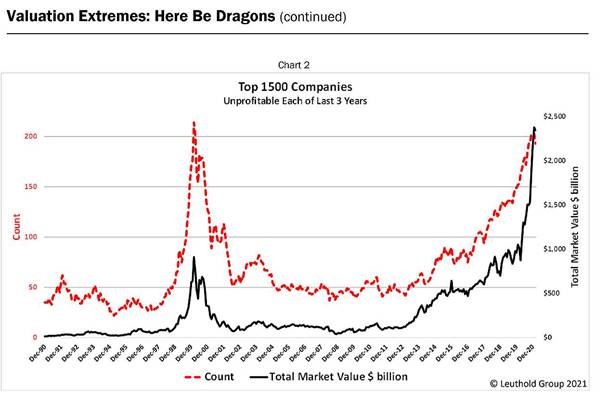
Top 1500 Companies – Corporate Profits
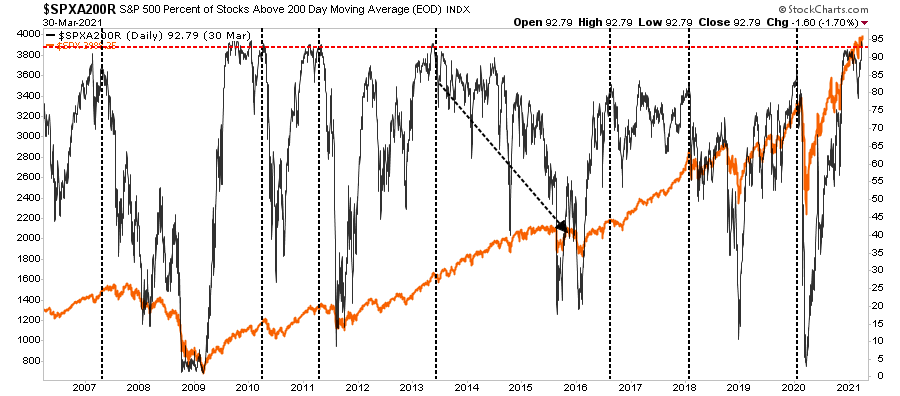
For now, that hasn’t mattered as the number of companies trading above their 200-dma is at some of the highest levels on record as well. When virtually every stock in an index is in a bullish trend, it is usually a warning sign.
The Issue Of Margin Debt
This exuberance requires “fuel,” which brings us to margin debt. As I explained previously:
“Margin debt is not a technical indicator for trading markets. What margin debt represents is the amount of speculation occurring in the market. In other words, margin debt is the ‘gasoline,’ which drives markets higher as the leverage provides for the additional purchasing power of assets. However, ‘leverage’ also works in reverse as it supplies the accelerant for more significant declines as lenders ‘force’ the sale of assets to cover credit lines without regard to the borrower’s position.”
The last sentence is the most important. The issue with margin debt, in particular, is that the unwinding of leverage is NOT at the investor’s discretion. It is at the discretion of the broker-dealers that extended that leverage in the first place. (In other words, if you don’t sell to cover, the broker-dealer will do it for you.)
When lenders fear they may not recoup their credit-lines, they force the borrower to either put in more cash or sell assets to cover the debt. The problem is that “margin calls” generally happen all at once, as falling asset prices impact all lenders simultaneously.
Leverage Extremes
Such is what we saw happen with Credit Suisse (SIX:) and Nomura Securities recently. As concerns over forced liquidations of a major hedge fund grew, positions were being liquidated “en masse” to try and stem the potential losses. The bloodletting, when this occurs, is always faster and deeper than most imagine.
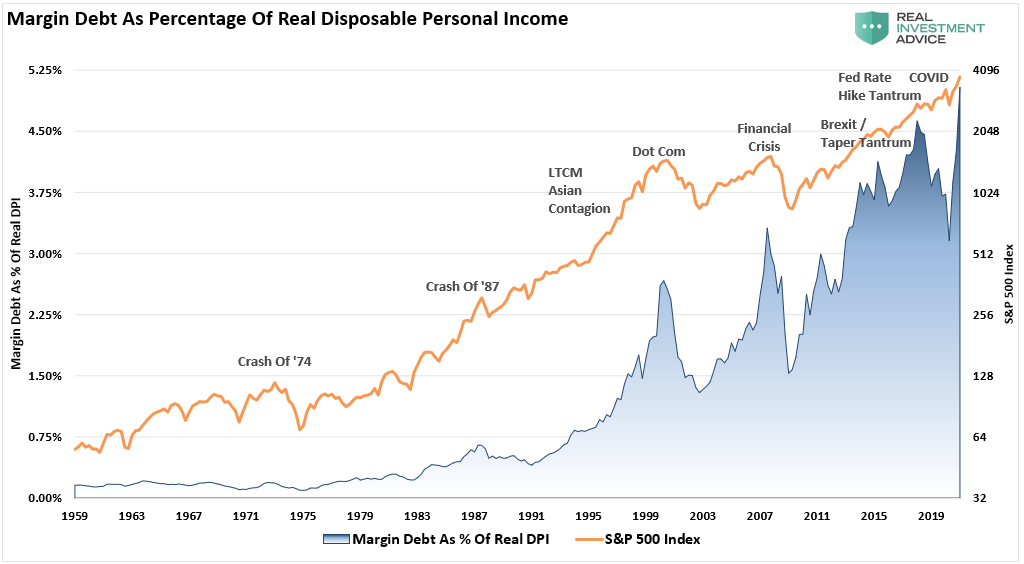
Currently, the exuberance of investors is on full display. With a fresh round of “stimmy” checks reloading bank accounts, margin debt as a percentage of real disposable incomes has shot to record highs. (You may want to pay attention to previous peaks.)
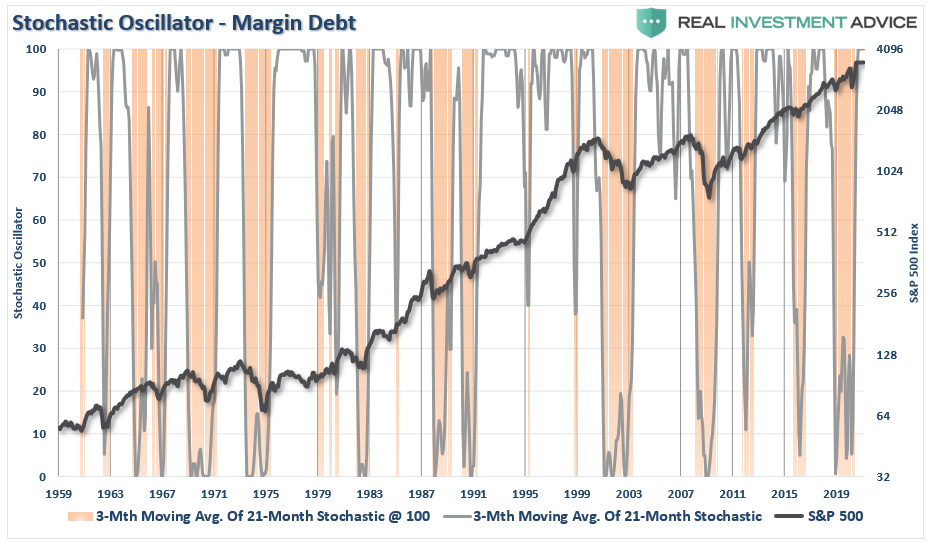
If we apply a “stochastic indicator” to margin debt, such also confirms we are at extremes normally associated with lower future return rates. While such is not an immediate issue, which investors dismiss as “wrong this time,” it does suggest increased risk over the next few months.
Such is always the case with “margin debt.” It is NEVER an issue—until it is.
Margin Debt Confirms The Exuberance
As noted, when markets are rising and investors are taking on additional leverage to increase buying power, margin debt supports the advance. However, the magnitude of the recent surge in margin debt also confirms the current levels of investor exuberance.
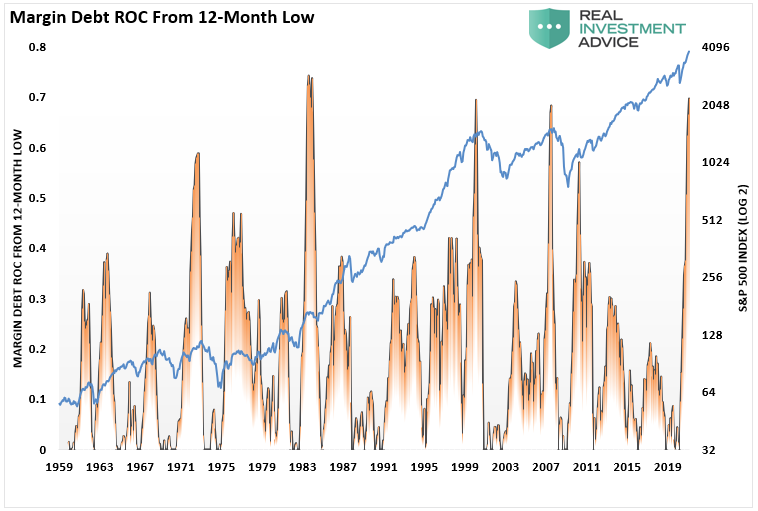
The chart below shows the rate of change from the lowest point of margin-debt over the last year. Increases in margin debt are primarily not an issue. It is when there are exceedingly sharp increases in debt that generally signal trouble for markets ahead.
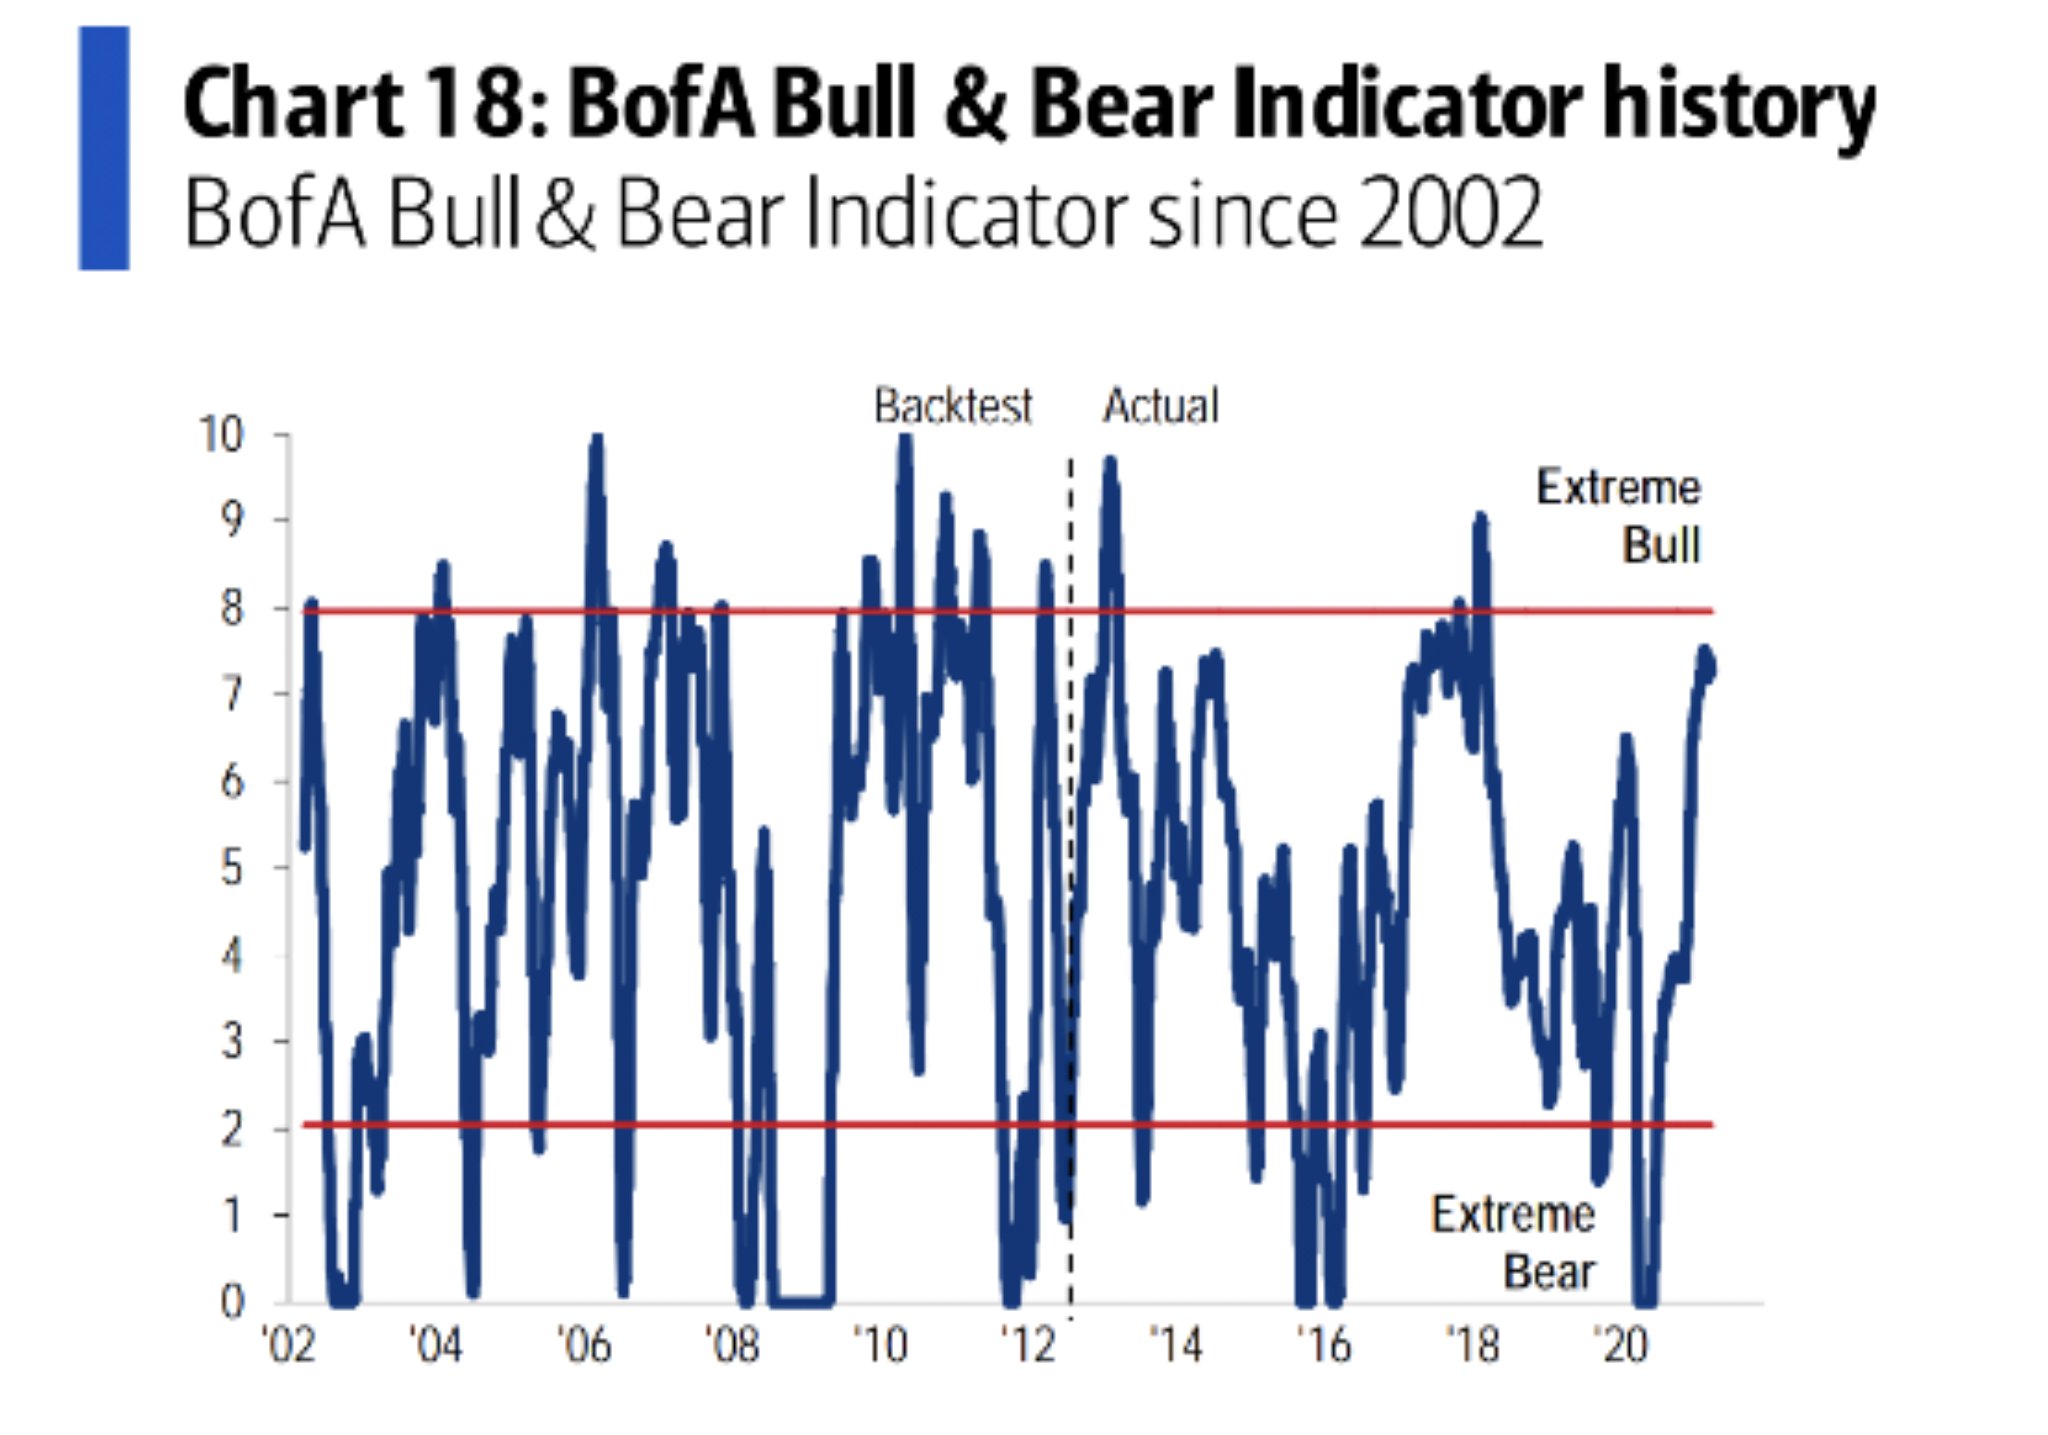
That surge in margin debt is not the “cause,” but rather the reflection of the “bullish market mania” which has engulfed investors currently. We can see that exuberance in BofA’s indicator.
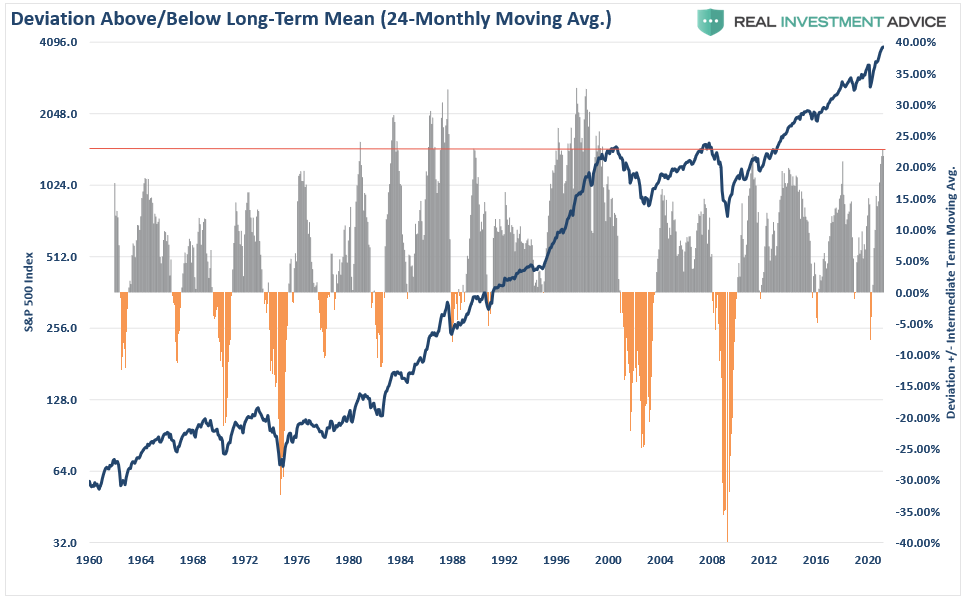
Such is also reflected in the extreme price deviations from the ’s two-year (24-month) moving average.
As noted in the highest correlation between stock prices and future returns comes from valuations.
“Short-term price changes of stocks are based solely on liquidity, or the balance of buyers and sellers. Over longer periods, price changes become more dependent on valuations and less on supply and demand. The following scatter plots compare CAPE valuations to subsequent 10-year and 3-month returns to highlight this fact.”
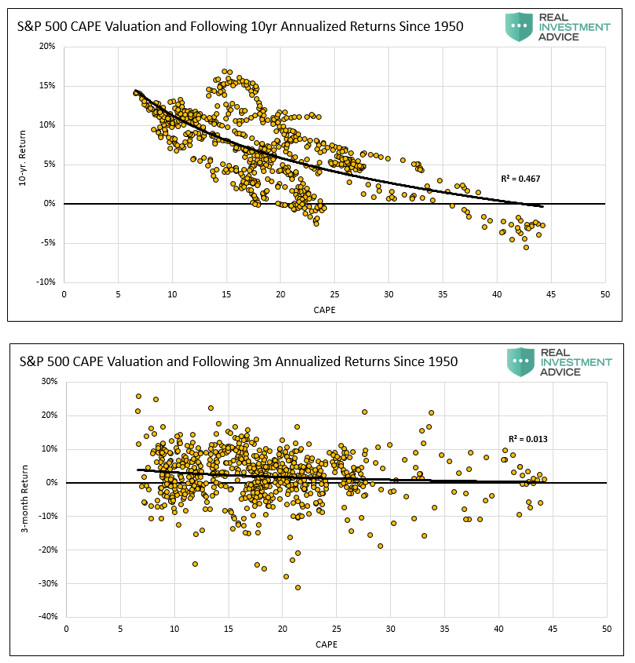
S&P 500 CAPE Valuation And Following 10 Yr Annualized Returns
“Stocks are extremely expensive. Regardless of whether you agree with our earnings model or not, drawdown risk is higher today than at almost any other time. The Goldman Sachs table below uses multiple valuation metrics and comes to the same conclusion.”
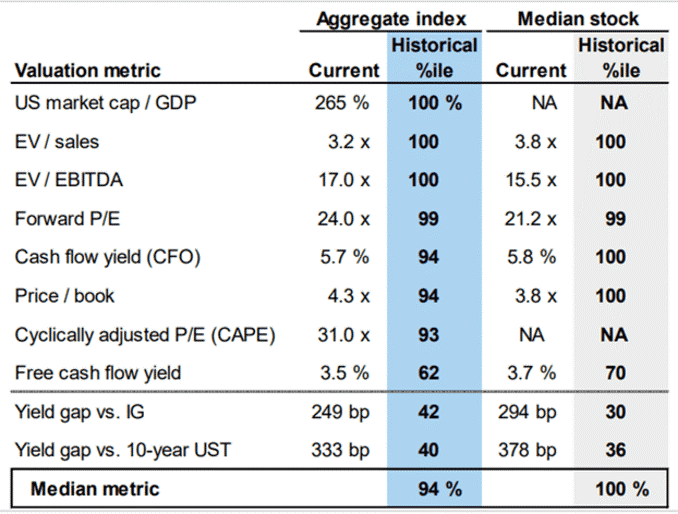
This Time Is Different
As noted by Jason Zweig, this has indeed been a “stock ‘gamblers’ market.”
“You could have made good money even with bad stock picks. It was like being invited to bet on black, without limits, at a roulette wheel on which 37 of the 38 pockets were black.
Why waste time and energy educating yourself while sheer ignorance pays off so easily?”
Yes! This time is indeed different. But, so was every previous overly exuberant bull market in history. As Sentiment Trader summed up the last time we wrote on this topic, such is usually not the case.
“Whenever some of this data fails to lead to the expected outcome for a few weeks or more, we hear the usual chorus of opinions about why it doesn’t work anymore. This has been consistent for 20 years, like…
- Decimalization will destroy all breadth figures (2000)
- The terror attacks will permanently alter investors’ time preferences (2001)
- The pricking of the internet bubble will forever change option skews (2002)
- Easy money will render sentiment indicators useless (2007)
- The financial crisis means relying on any historical precedents are invalid (2008)
- The Fed’s interventions mean any indicators are no longer useful (2010 – present)
All of these sound good, and for a time it seemed like they were accurate. Then markets would revert and the arguments would get swept into the dustbins of history.”
While this time is certainly different due to unprecedented interventions, we suspect the outcome will eventually be the same.
Increasing Portfolio Exposure
Here is where I throw you a curveball.
While I just laid out all of the longer-term risks, we just increased exposure to portfolios for the end of the seasonally strong period.
Such is the point that many miss about our analysis. While we are most definitely “bearish” in our views (both technical and fundamental) longer-term, we also understand over the next few days or weeks it is “sentiment” that carries the market.
As such, we increased exposure in some of our beaten-up growth stocks, while continuing to barbell those positions with the “reflation/recovery” momentum trade. Our job as portfolio managers is to make sure we are creating returns for our clients, with a strict set of “risk controls” in place to protect capital.
At the moment, it certainly feels as if the market is unstoppable. Such is usually the case in “heat of the mania.” As Warren Buffett once quipped:
“The market is a lot like sex, it feels best at the end.”
We remain “bullish” on the markets currently as momentum is still in play. However, it is likely that by mid-summer we will see a decent correction as the “peak” in the economic and earnings data becomes visible.
Such is why I agree with Jason’s conclusion:
“Where ignorance is bliss, ‘tis folly to be wise,” wrote the British poet Thomas Gray. One of these days, perhaps sooner rather than later, stocks will stop going up and the importance of understanding what you own will reassert itself. For the time being, though, investors who used to think of themselves as wise may continue to look foolish.”


