

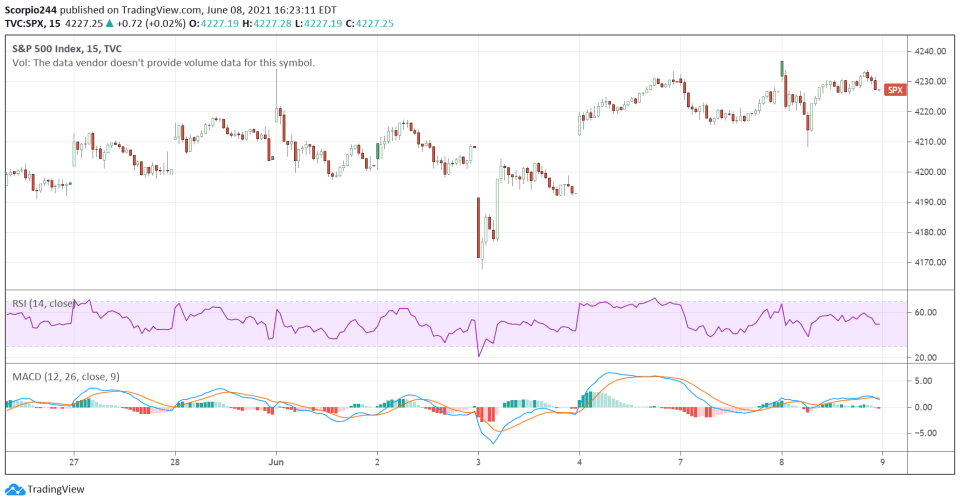
Stocks finished flat once again yesteday, with the up 2bps. There is a fascinating pattern forming here. Since May 27, we have managed to gap higher 6 times, with only one time leading to a higher close on June 4, Friday. The rest of the time, we basically finished the day flat. It suggests that buyers have enough energy to open the market higher, but not enough to finish the job, allowing the sellers to take over. I’m just wondering at what point this pattern breaks and what the result will be.
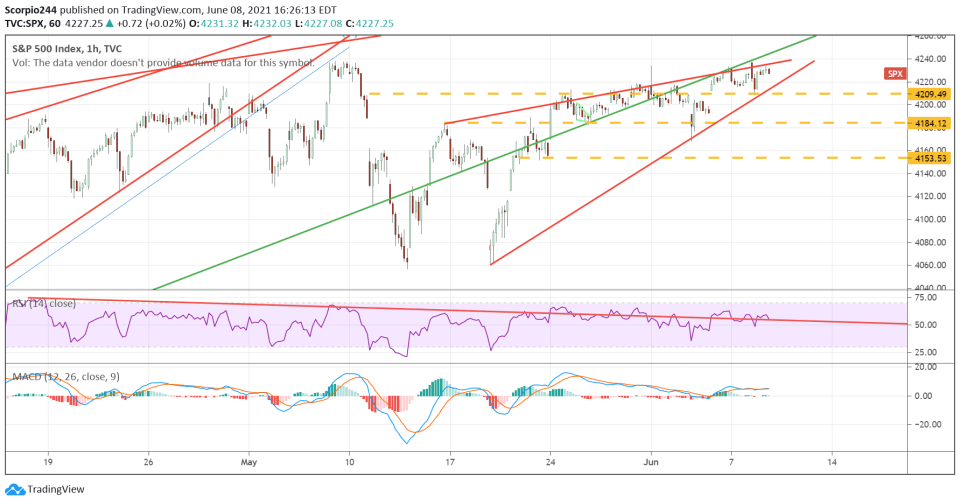
A rising wedge pattern has formed in the S&P 500 going back to May 17, and if it has anything to say about what happens next, it seems highly likely the index breaks lower. It is, after all, a bearish technical pattern. So we will wait and see how this all goes. But a pullback to 4,190 is certainly a big possibility with more to fall after that.
Russell 2000
Normally I would consider the rising as a bullish indicator for the broader market, but that is not the case anymore. The index has been taken over by these most shorted stocks leading the pack. Since the middle of May, it is pretty clear that the most shorted stocks are taking over. The Russell will only continue to go higher for as long the most shorted stocks continue to rise, making me call into question the quality of the rally.

Micron
Micron Technology (NASDAQ:) did not have a good day at all, volume levels spiked, and the stock moved back to support around $80. There is no sign of the downtrend in the RSI breaking yet, while the MACD appears to be getting ready to roll over as well. These are all bearish trends that suggest a move to $74 is highly likely.
 Daily Chart")
Intel
Intel (NASDAQ:) saw some bullish option betting, and I noted it in this morning’s note. The stock is hovering around resistance at $57-58, and it would take a move above $58 to get it to moving higher towards $62.50.
 Daily Chart")
Bank of America
Bank of America (NYSE:) was a stock I saw bearish options betting in last week, and now it appears it may be getting ready to break down. A drop below $42.50 would be a big problem for the shares and likely signal a decline to around $39.70.
 Daily Chart")
Deere
What’s going on with Deere (NYSE:)? The stock has broken its uptrend, the RSI and MACD are trending lower, signaling lower prices to come. A break below $350 would signal a further drop to $332.
 Daily Chart")