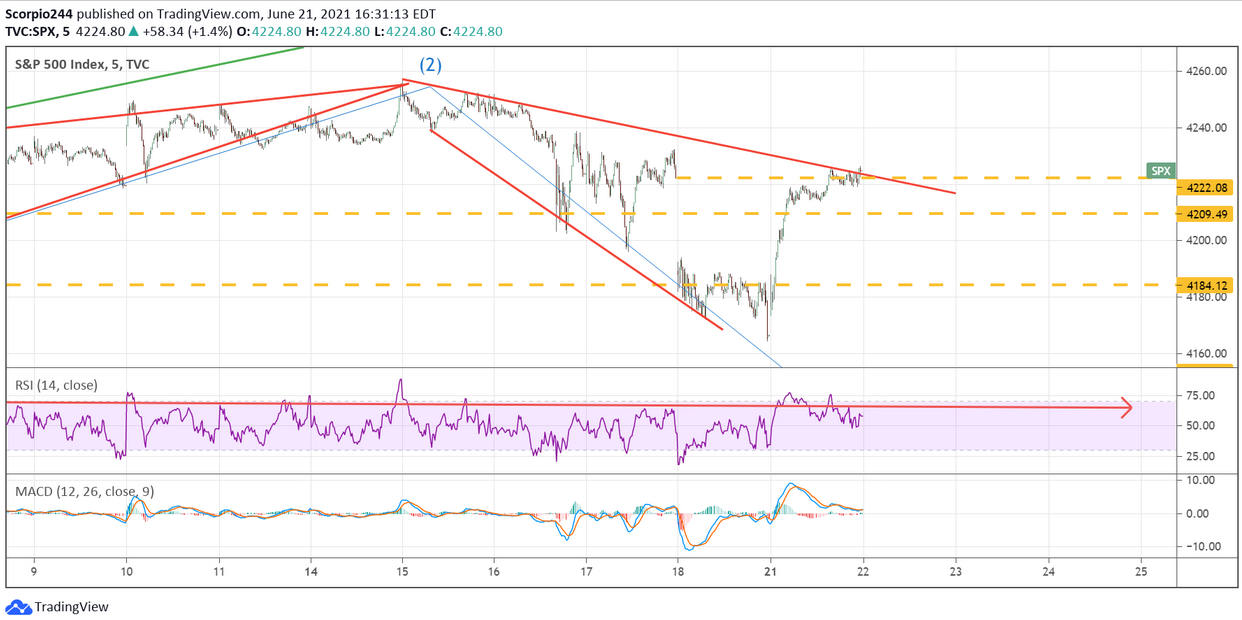
Stocks rose sharply on Monday in a large snapback rally from oversold conditions. The managed to fill the gap from Friday’s sell-off; the only surprise was how fast it filled. I tend to think the selling price action is not over yet.
The news from last week was a big change from the Fed, and those changes don’t typically just get brushed off.
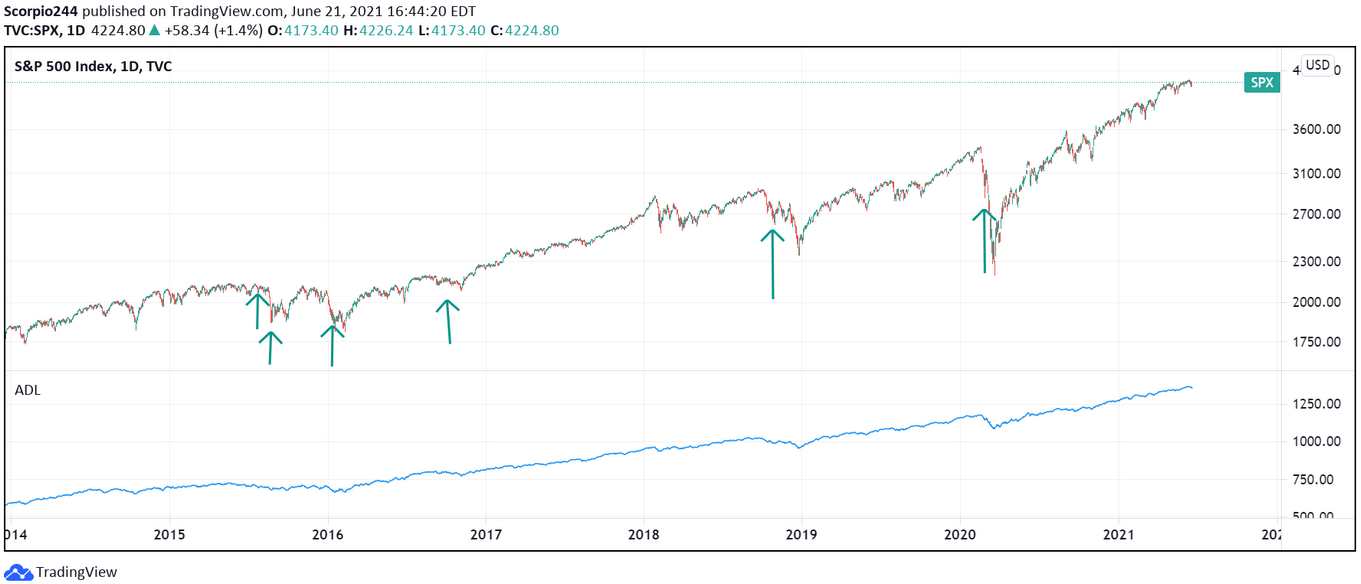
Additionally, it isn’t often that the advance/decline falls 6 days in a row, let alone 7, so the S&P 500 was overdue for a snapback. In fact, the last time the advance/decline fell 6 days in a row was on February 28, 2020; before that, it was around October 24, 2018, January 13, 2016, August 25, 2015, and July 24, 2015. Now, I don’t remember exactly, but those weren’t the smoothest periods.
So is the bottom in? Maybe. But history would suggest there is a good chance it is not. The chart below shows the times when the Advance/Decline fell 6 days in a row.
Transports
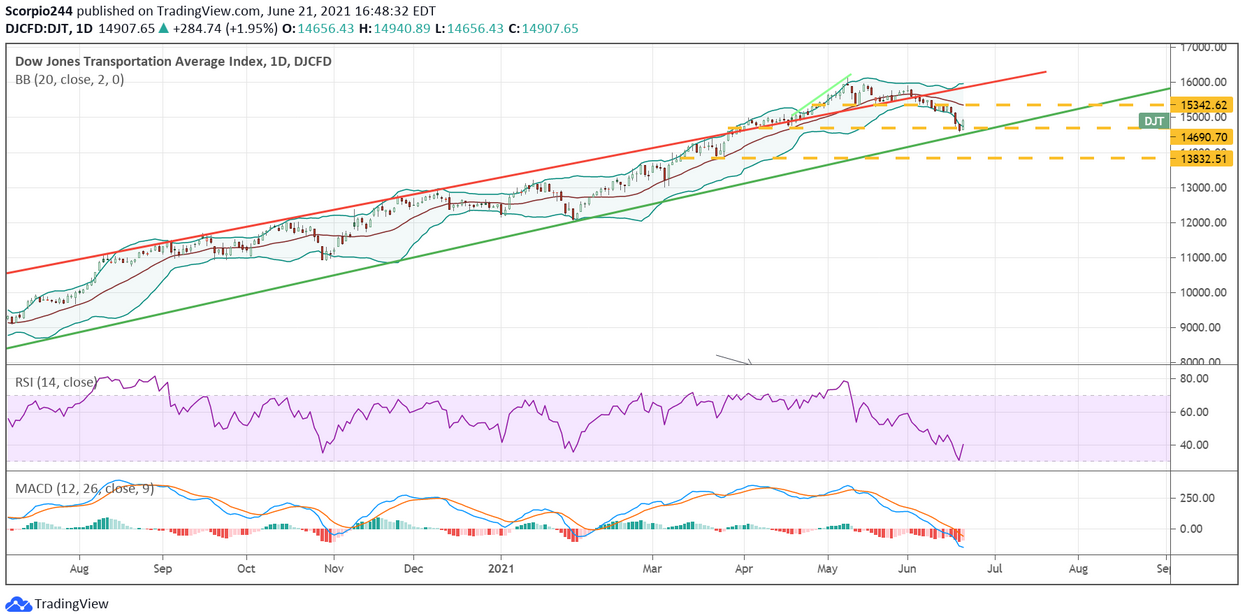
The were completely oversold on the RSI and the Bollinger® Bands. It even hit the long-term uptrend. So again, no surprise there was a bounce; there might be some follow-through even today.
JPMorgan
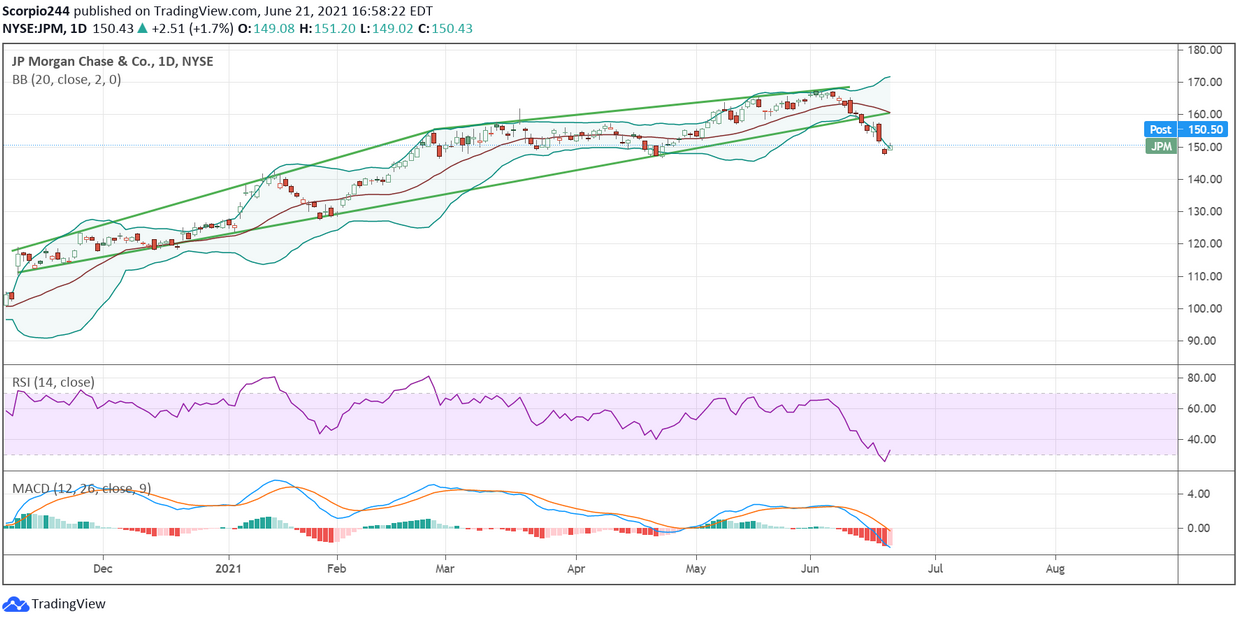
JPMorgan (NYSE:) had a good day yesterday, reversing some of last week’s losses. Again, like the rest of the market, Monday appears to have been a bounce off of oversold conditions. Could it rebound some more later today? Yes. Does it matter much? Not if spreads continue to collapse.
UPS
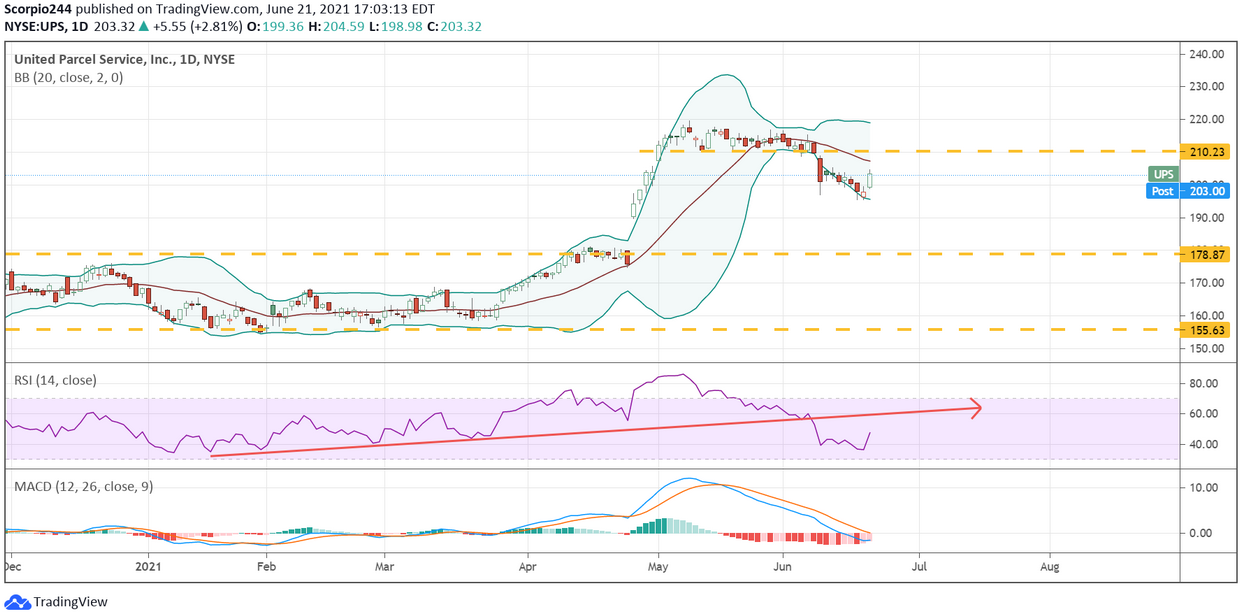
United Parcel Service (NYSE:) seems no different, with the potential to push back to the 20-day moving average at $207.35.
Micron Technology
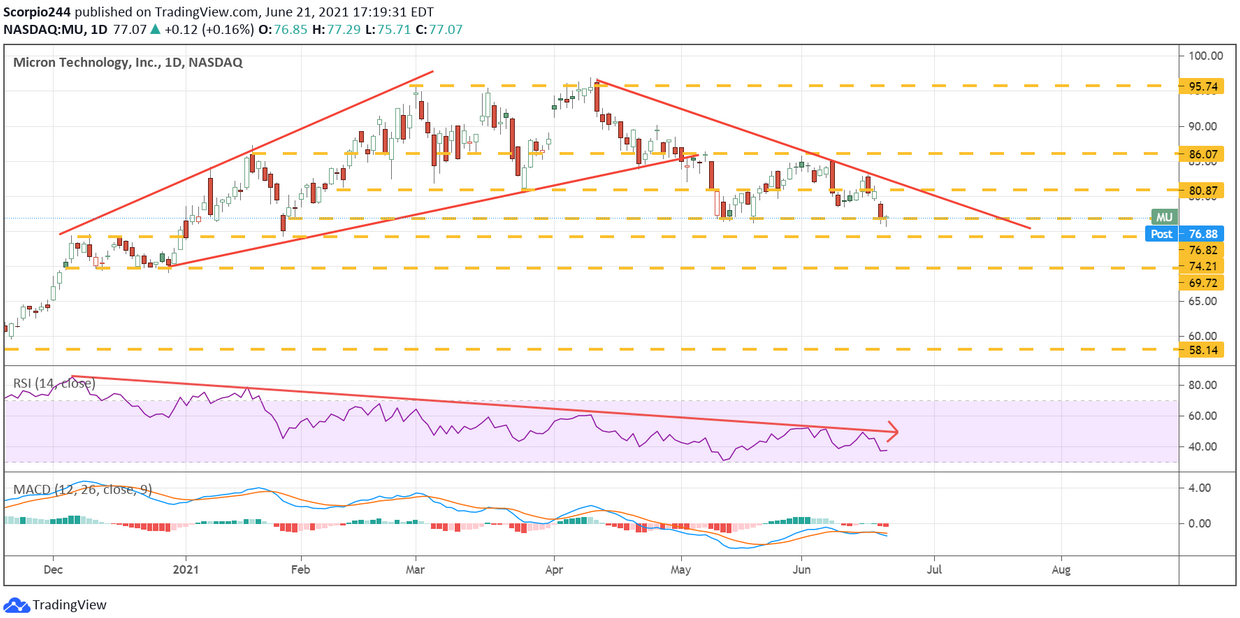
Micron (NASDAQ:) has traded horribly, and despite the market being up sharply as of yesterday, this stock did nothing. I don’t know what to say here, but the price action is overwhelmingly negative.
Bitcoin
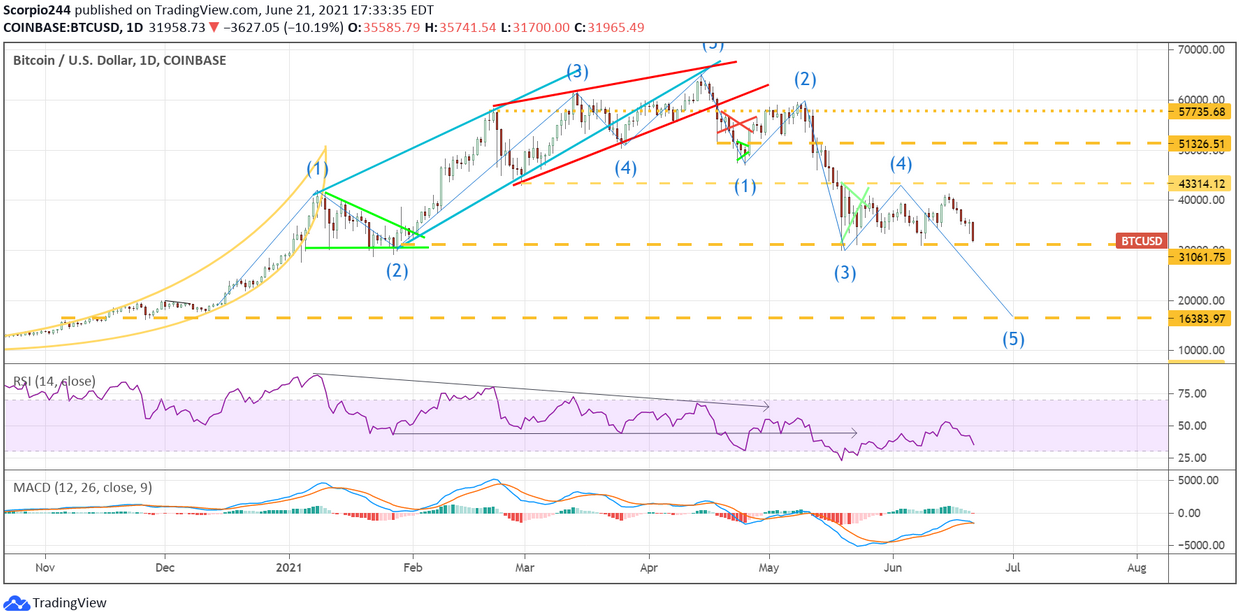
(BTC) traded down on Monday, another 9%. I’m just waiting for this thing to break 30,000. Once it breaks 30,000, it lights out. The next stop is probably around 16,000. Yesterday, I noted that it was very close to breaking an uptrend . Indeed, it is very close to breaking support on the linear chart.
If there was actually some fundamental way to value Bitcoin, there might be a level where buyers would have some confidence to step in. But since Bitcoin-only trades on emotions and imagination, there is no way to guess where a reasonable place would be that the crypto may stop. So the charts are all you have. Good luck…
