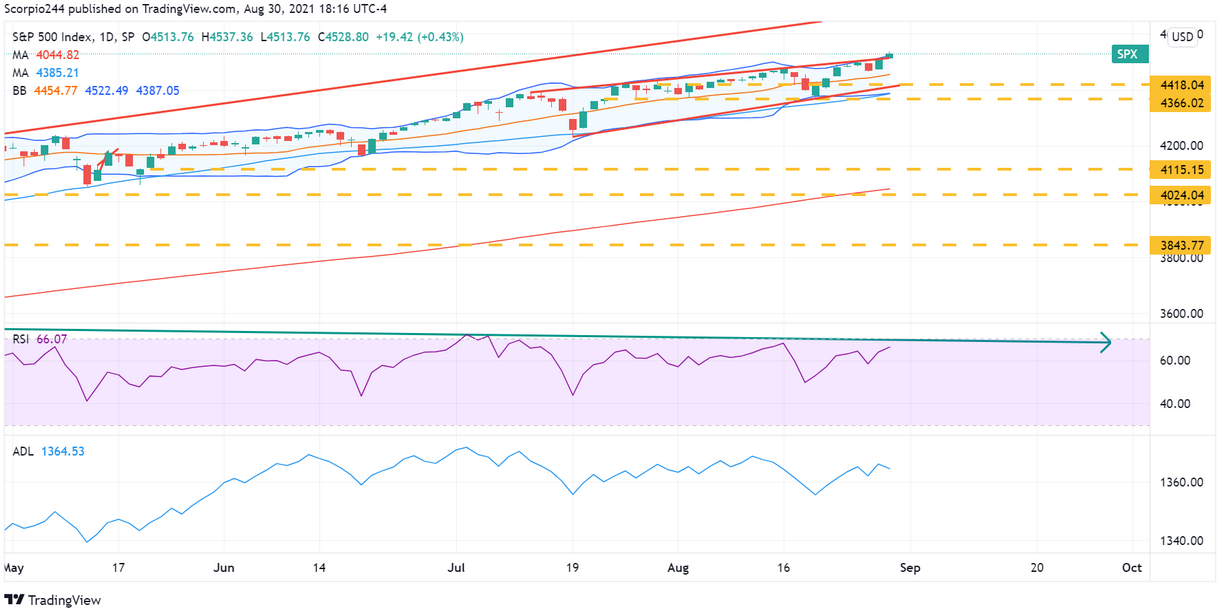
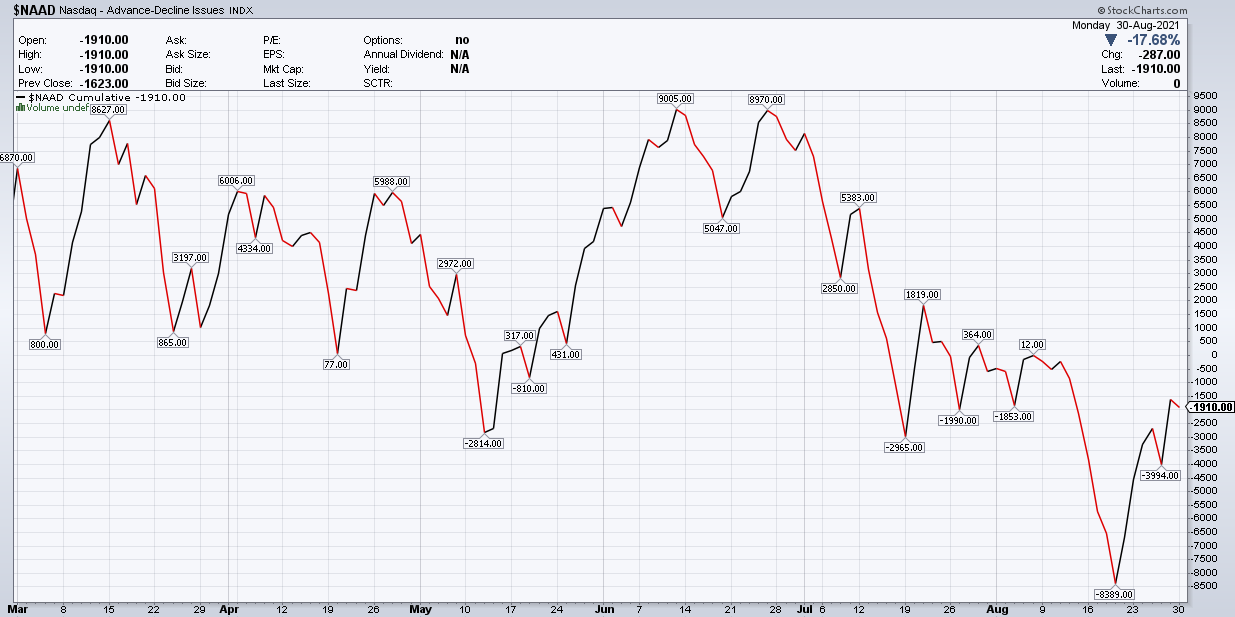
Stocks finished the day Monday mostly higher, with the up roughly 40 bps. Despite the positive day, the advance/decline line fell and has not confirmed any of the new highs for the S&P 500 since the A/D line peaked at the beginning of July.
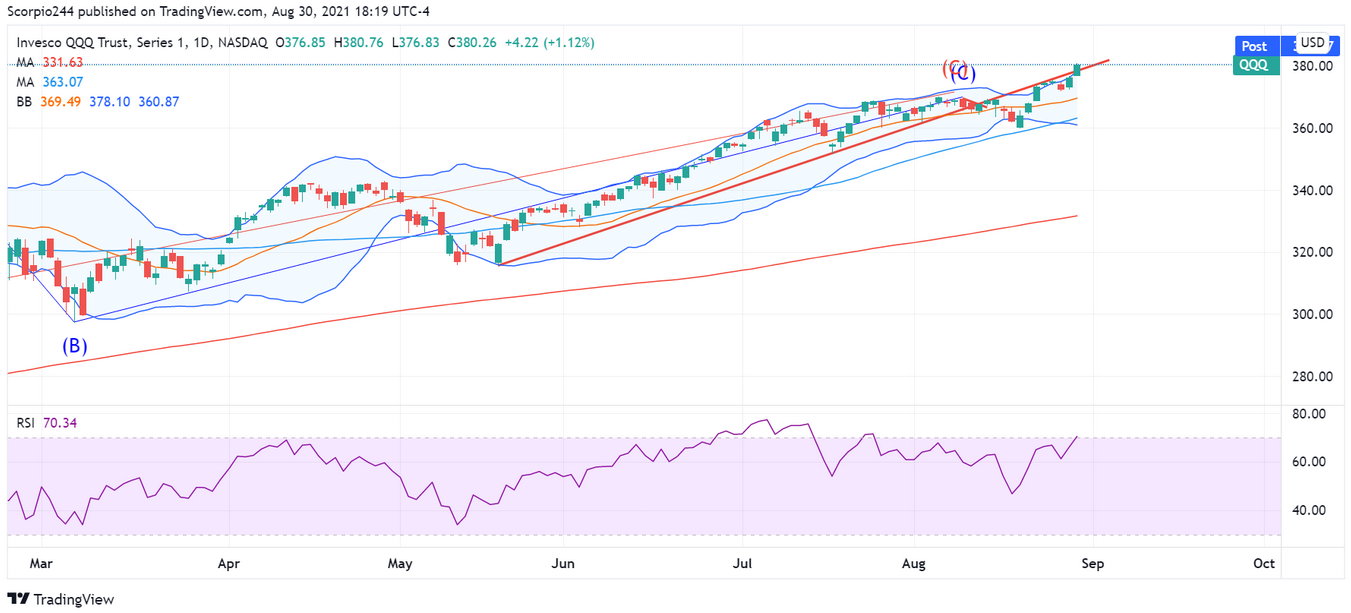
Regardless the S&P 500 is now trading above its upper Bollinger® band, indicating it is over-bought. The pattern has been to reverse and retrace back to the lower Bollinger band, which is around 4,390.
The s are overbought based on the Bollinger band and the RSI, based on those two indicators. That would also indicate that the Qs retrace, again potentially to their lower band around $360.
Meanwhile, the advance-decline line also fell and hasn’t seen a high since the end of June.
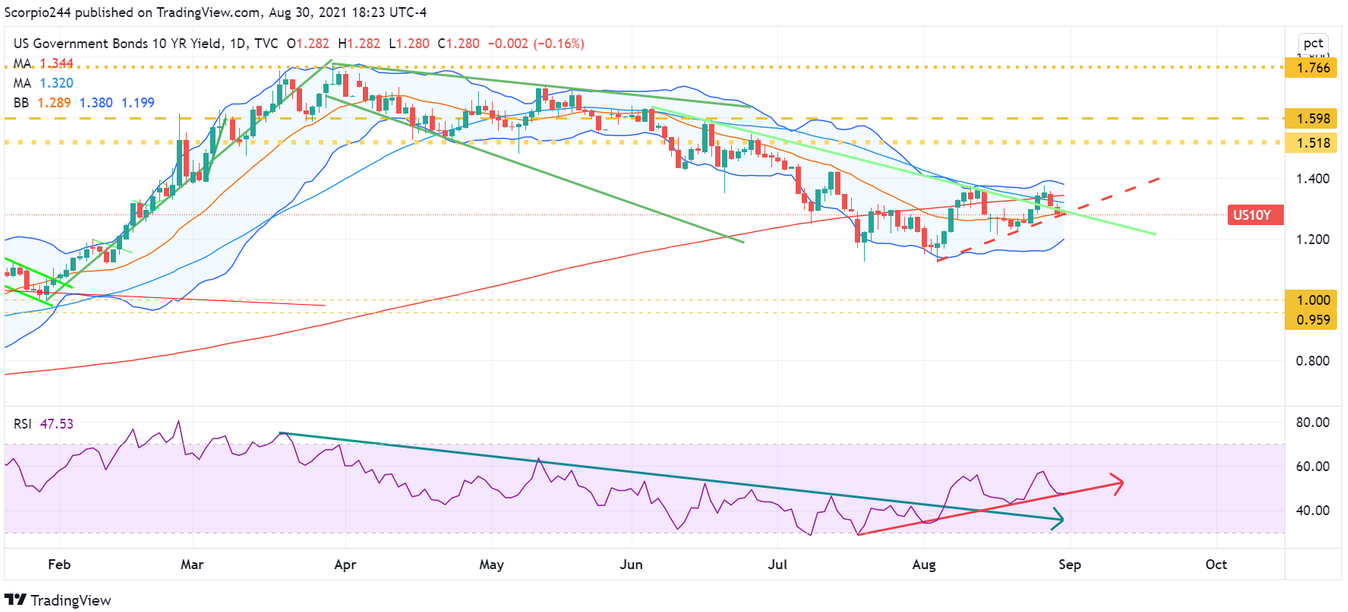
The fell slightly yesterday, but the RSI is still trending higher, indicating yields can climb from here over the very short term.
Zoom
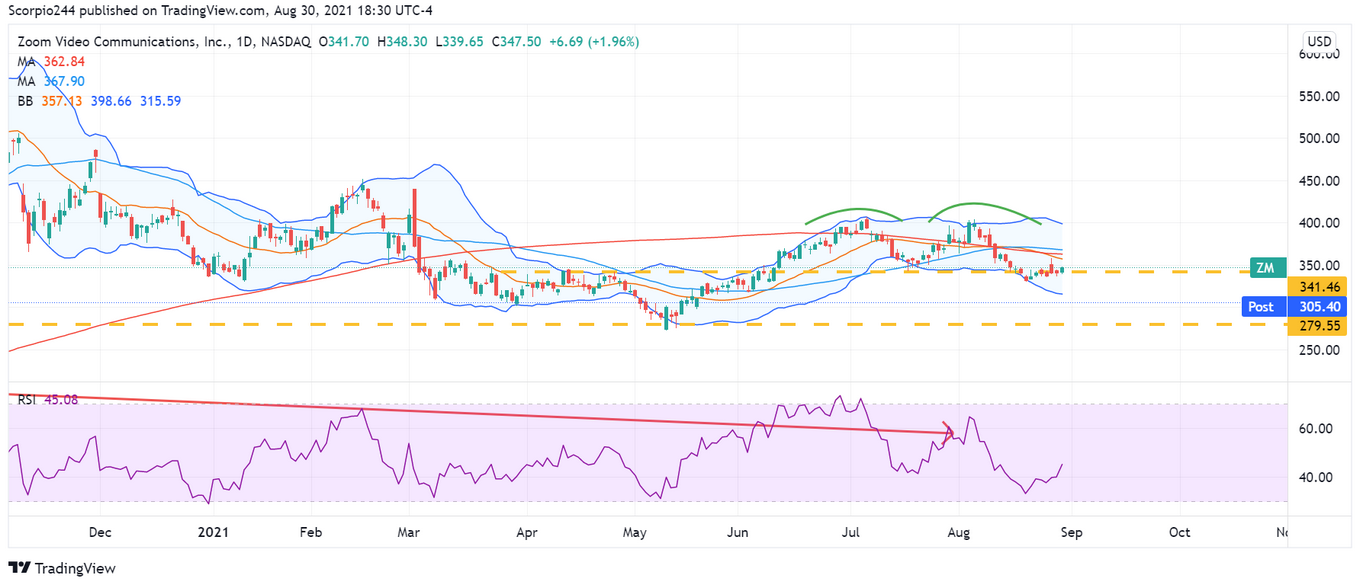
Zoom Video Communications Inc (NASDAQ:) got crushed after hours yesterday, which is what happens when you give inline revenue guidance and then on the earnings guidance, and you trade at 70 times 2024 earnings estimates and 18 times sales. As I have said multiple times, the company is not growing fast enough to fit into its valuation.
When a growth stock with a high valuation disappoints, it is toast; it will be dead money until the company reports next quarter, just like Amazon. There is no room for error.
The double top pattern should easily get confirmed today, with support at $280. Yeah, I know all those price targets are around $425; yeah, watch how they start getting cut.
Amazon
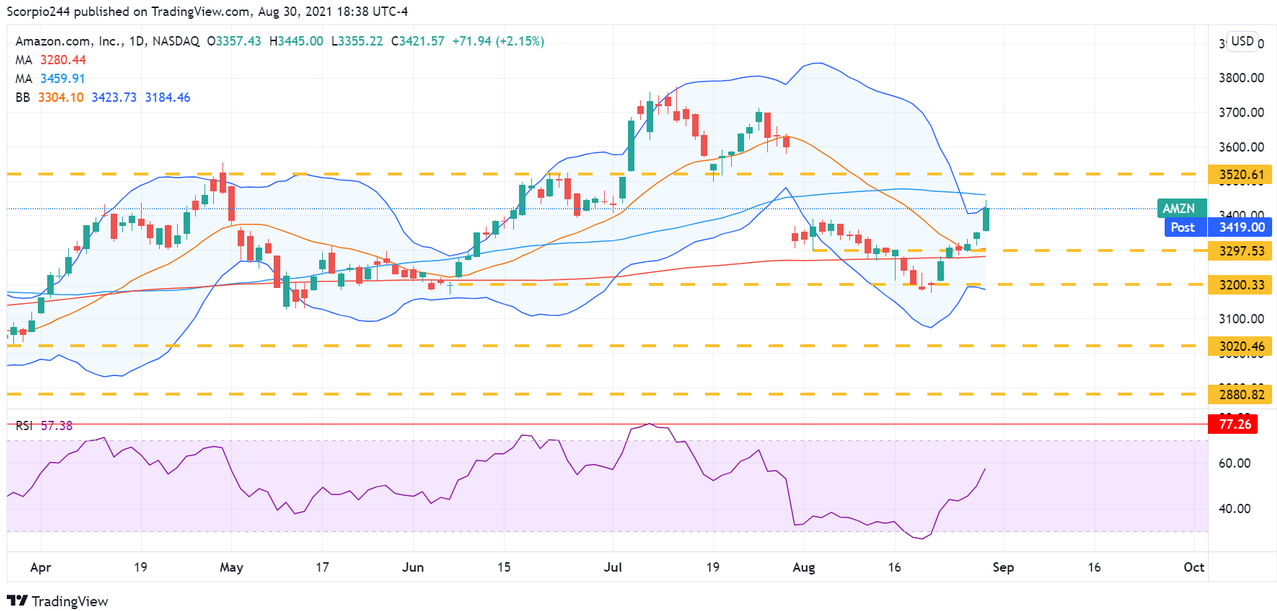
Speaking of Amazon (NASDAQ:), it rallied some 2% yesterday, making it back to its upper Bollinger band, and just a hair below its 50-day moving average. It could fill the gap at 3,600. I don’t see any reason why it should, given the terrible guidance they gave when they a few weeks ago. My guess is we see $3,300 before $3,600.
Mastercard
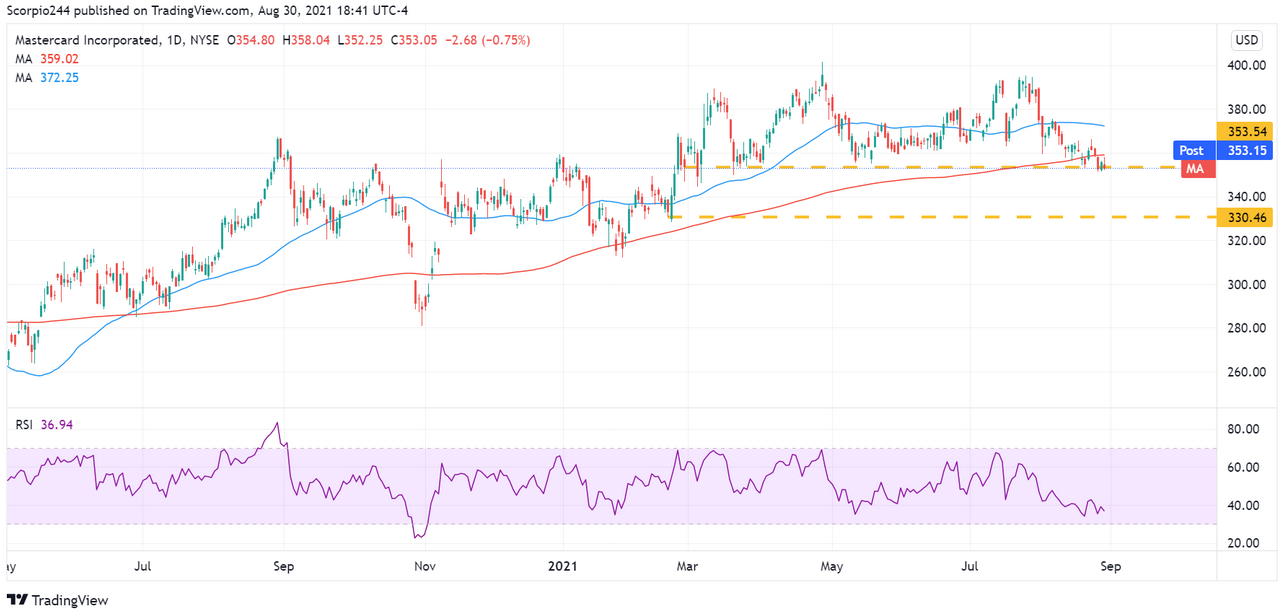
It is a little concerning that Mastercard (NYSE:) fell below its 200-day moving average and looks like it is really breaking down. I hope it can hold on to support around $350, but it isn’t looking good at this point. If $350 goes, we are probably looking for $325.
Micron
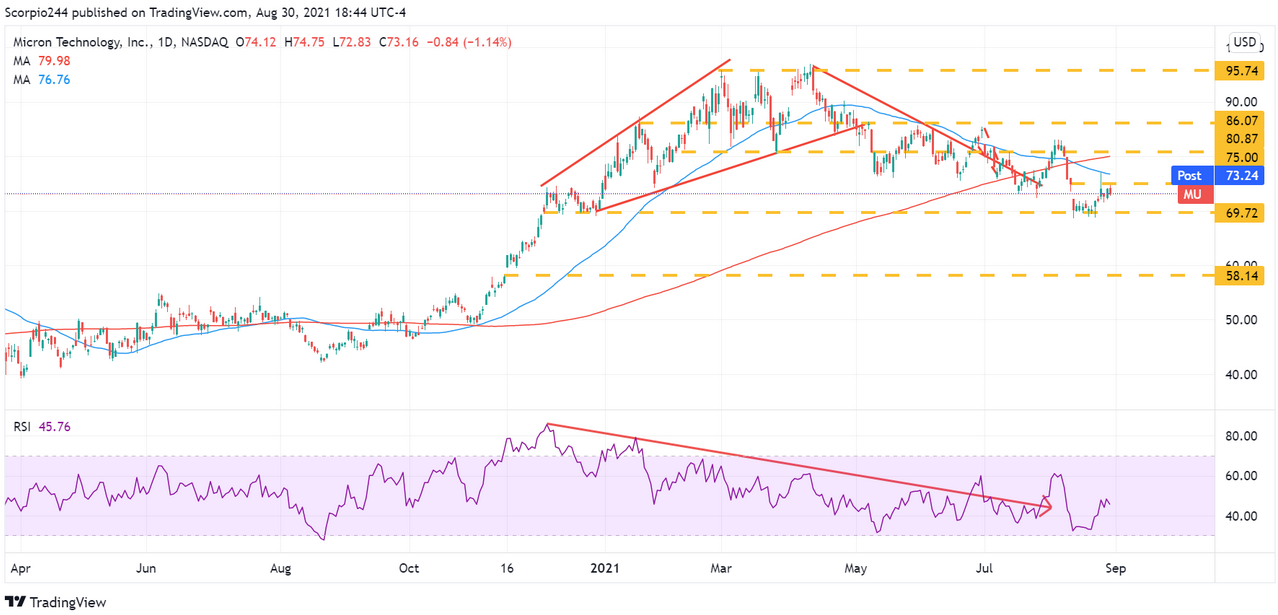
We can finish with Micron Technology (NASDAQ:) because everyone got excited and thought the stock was going higher. It was pretty clear it wasn’t going higher because it failed intraday at the 50-day moving average. The momentum is going all wrong, and I still think the stock sees $58 before it sees $86.
