Stocks were mixed on Monday, with the S&P 500 finishing down about 20 basis points, while the QQQ ETF finished higher by 60 basis points. The market received a boost in the final few minutes, which allowed it to rally back by around 30 basis points.
Overall, nothing dramatic took place in the markets, with some consolidation after a big move higher. Newsflow is really light, with the focus mostly around another round of stimulus, again.
I think we are currently in the middle of a giant rising wedge pattern in the S&P 500, and if that is the case, then we should be getting ready for a rather sharp move lower here. There are so many gaps that need to be filled at lower levels we could see the index drop to as far as 3,200 to 3,300.
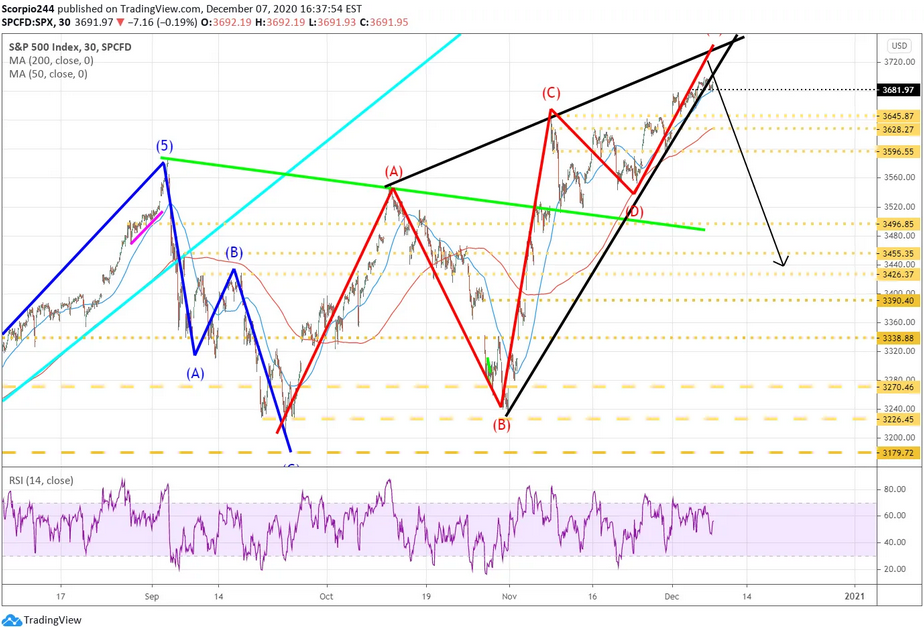 S&P 500 30 Minute Chart
If you want to really see something, check out this rising wedge pattern off the March lows. It is present in the RSI too.
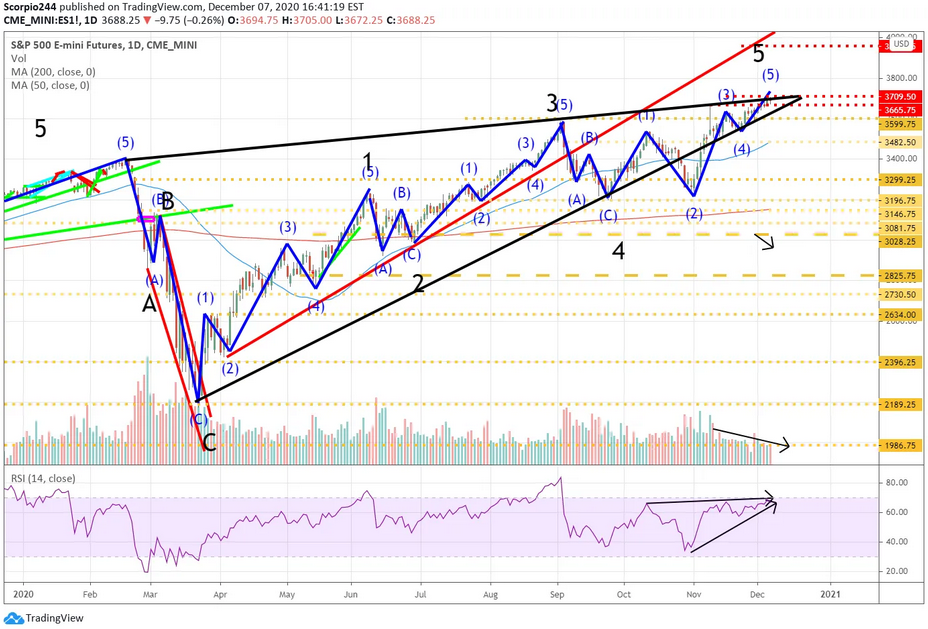 S&P 500 Emini Futures – Daily Chart
Moving on…
Amazon
Amazon (NASDAQ:AMZN) stock is struggling, despite everyone in the world know they will have a killer holiday season. Its already been priced into the shares. Now, could the stock break out and soar ahead of the already known? I guess anything is possible. But the shrinking volume and negatively sloping RSI suggest it isn’t likely. I’m watching for a break below $3,100 to drag in more sellers and push the stock lower.
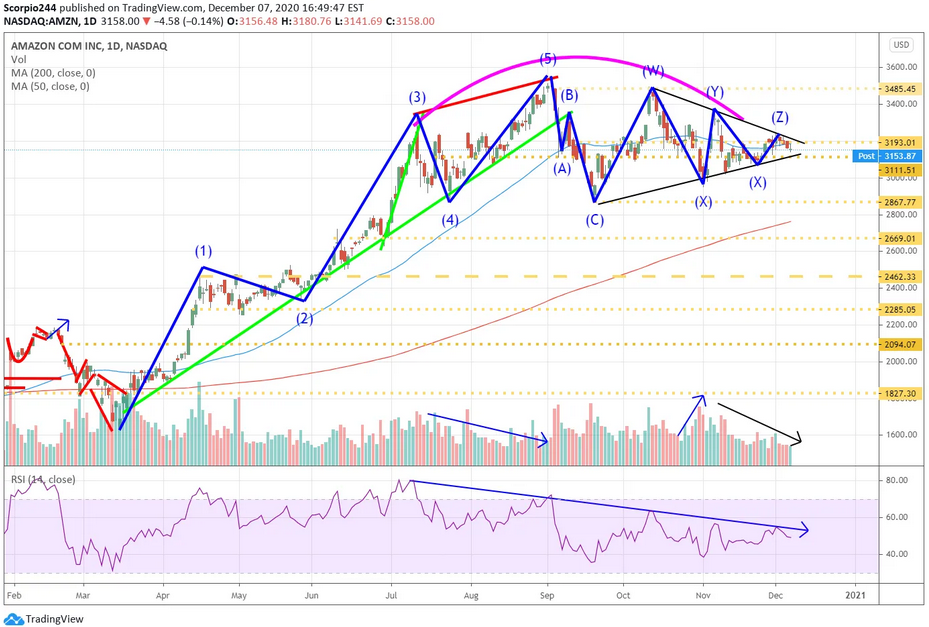 Amazon Inc Daily Chart
Roku
I’m not sure why Roku (NASDAQ:ROKU) keeps going higher; its valuation is nuts, along with volume that is drying up and an RSI going in the wrong direction. Good luck with that; it won’t be pretty when it breaks.
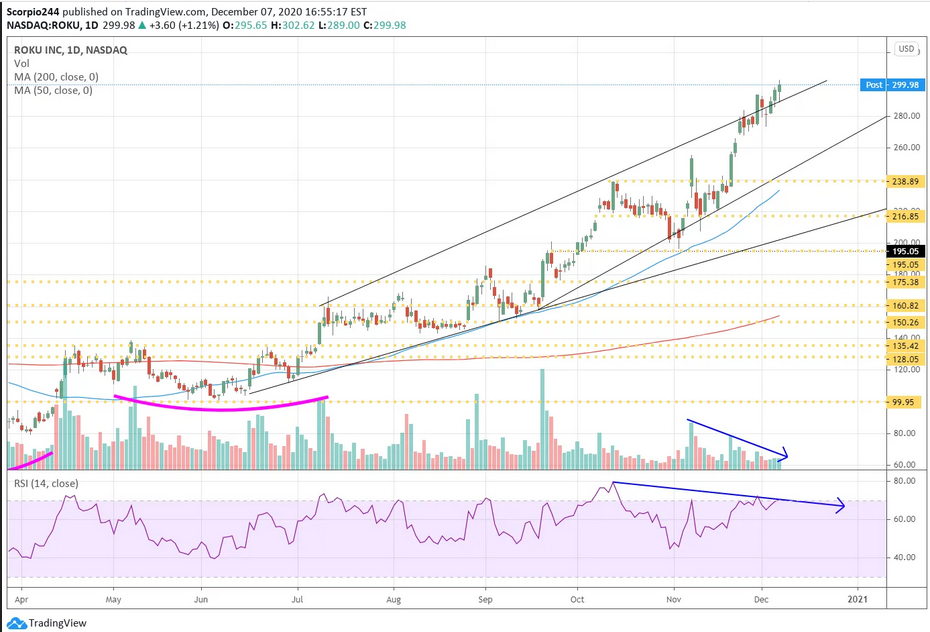 Roku Inc Daily Chart
DocuSign
DocuSign (NASDAQ:DOCU) fell yesterday and has completed its gap fill from its post-earnings jump. The stock has failed three times at resistance around $246. I guess that means we will have to wait and see if this overvalued stock rises further or fall; my guess is lower.
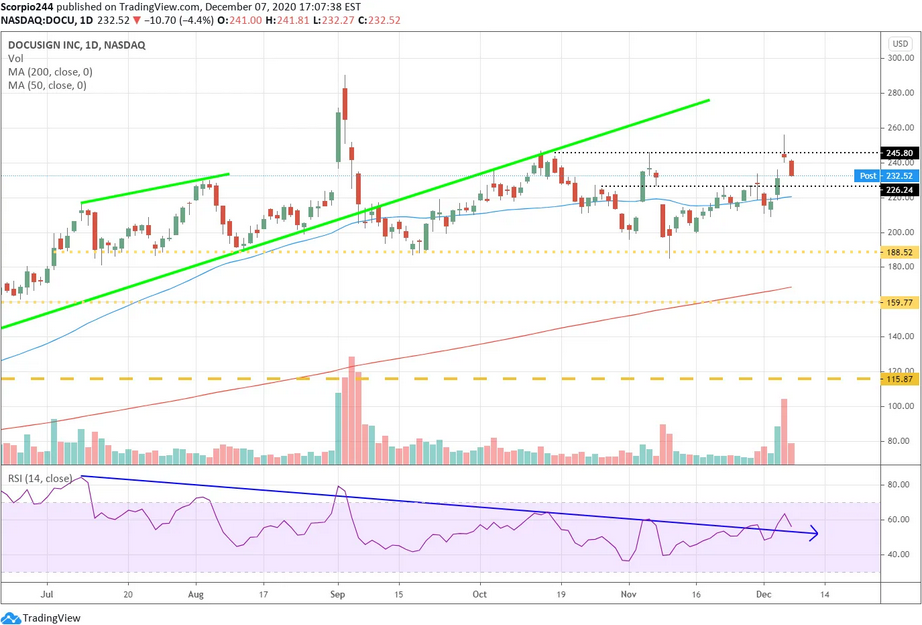 DocuSign Inc Daily Chart
