After six exciting green days, stocks hit all-time highs on Thursday as the rally continues. This morning, futures are softer following weak earnings reports from (NYSE:) and (NASDAQ:).
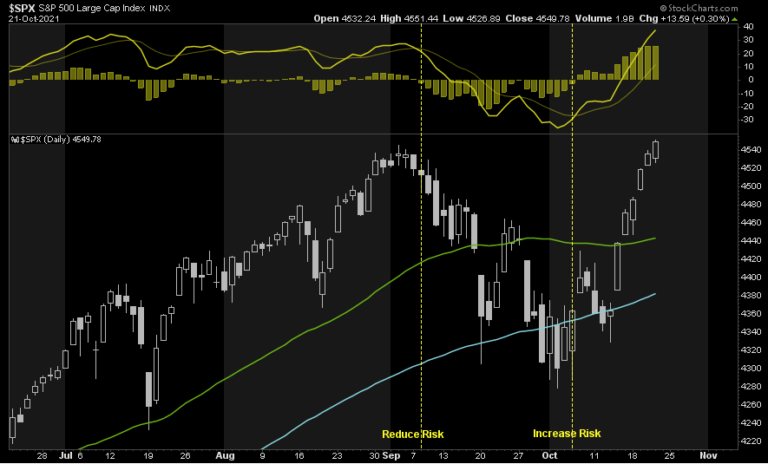
Earnings continue to dominate the news feeds and push individual stocks and markets around. Expect those stocks with earnings announcements to have larger than normal moves. speaks this morning at 11 am ET. Pay attention to whether or not he sticks with the plans for QE as the recent Fed minutes discuss.
We suspect he will.
What To Watch Today
Economy
At 9:45 ET this morning we will see:
- , October preliminary (60.5 expected, 60.7 in September)
- , October preliminary (55.2 expected, 54.9 in September)
- , October preliminary (55.0 in September)
Earnings
Pre-market
- 6:30 a.m. ET: Honeywell International (NASDAQ:) to report adjusted earnings of $2.00 per share on revenue of $8.64 billion
- 6:55 a.m. ET: VF Corp (NYSE:) to report adjusted earnings of $1.15 per share on revenue of $3.50 billion
- 7:00 a.m. ET: American Express (NYSE:) to report adjusted earnings of $1.77 per share on revenue of $10.54 billion
- 7:00 a.m. ET: Schlumberger (NYSE:) to report adjusted earnings of 36 cents per share on revenue. of $5.94 billion
Courtesy Of Yahoo
Market Getting Very Overbought Near Term
Very shortly, we will be releasing our Money Flow Indicator for all RIAPRO users. However, for now, I wanted to show you the current setup which is suggesting the current market rally may be approaching a short-term peak, and consolidation, following the recent run.
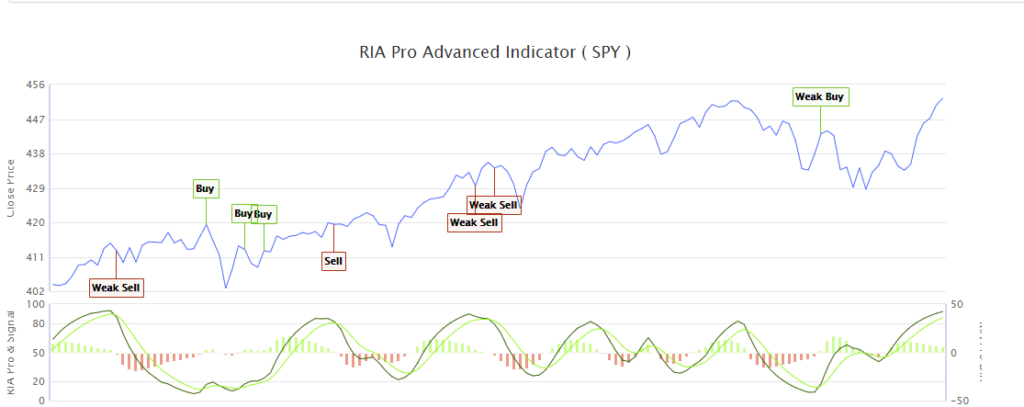
While the index has not turned negative yet, it is currently at a very high level. Normally, such positioning suggests more limited upside to markets near term. As you will notice, not all signals immediately result in a rally or correction, however, more often than not, the signals are worth paying attention to.
Federal Reserve Trading Policy
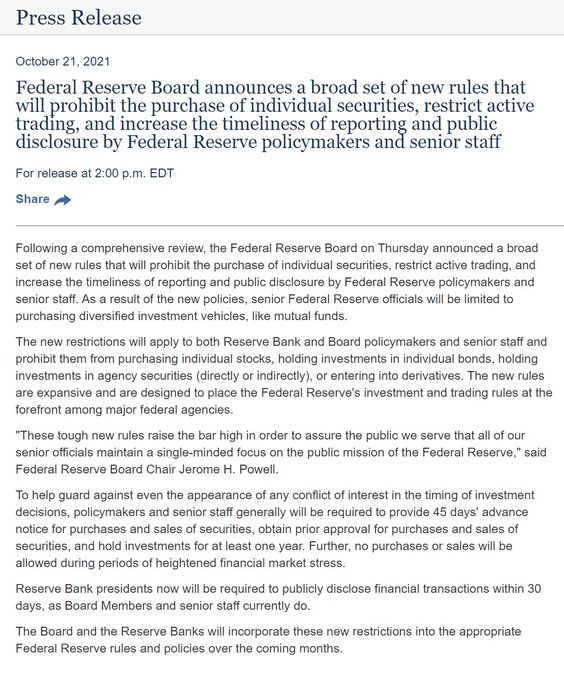
With the cat out of the bag, and many high-ranking Fed officials caught actively trading the markets with inside knowledge of what the Fed would say and/or do, the Fed is finally taking action. Per the press release below, Fed members are now subject to a number of strict rules that will greatly limit their ability to trade markets. For what it’s worth, the banks they regulate have had trading rules in place, like the ones below for decades.
Press Release
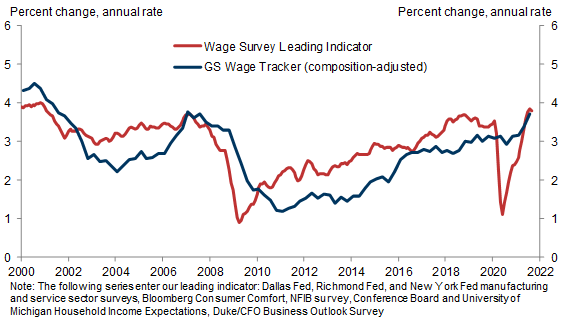
Tight Labor Market Leading To Higher Wages – More Inflation
“People are quitting low-paying jobs for higher-paying jobs. They are quitting great jobs for even better jobs. People are quitting to become their own boss. People are quitting because they don’t actually need the income.
To summarize, workers are not only quitting at historically high rates, but they’re also being increasingly choosy about picking their next jobs. The tight labor market is creating a self-reinforcing loop: Demand is strong, and prices are rising everywhere, but so are wages, as desperate employers trip over themselves to hike pay in a bid to retain and attract talent.” – YahooFinance
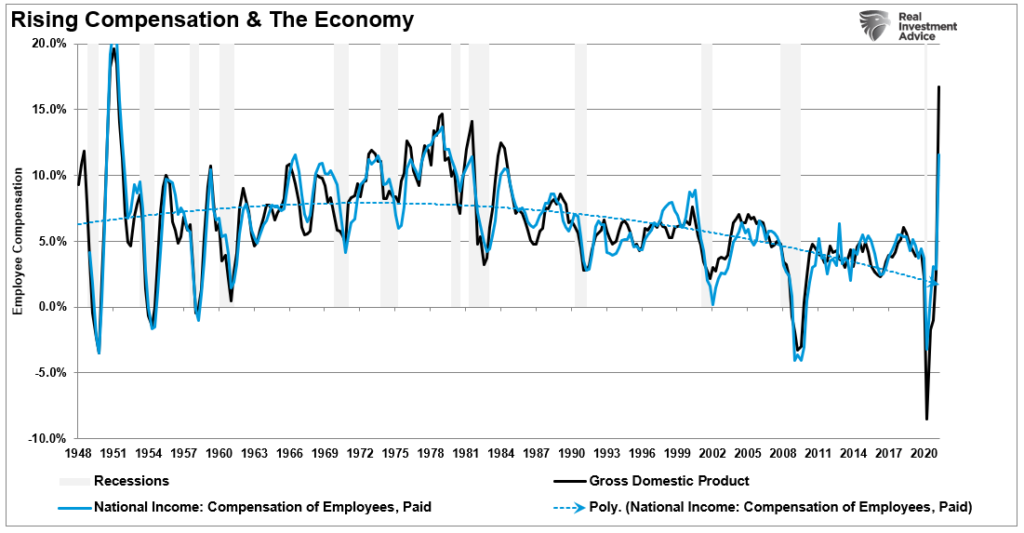
Percent Change, Annual Rate
It is worth noting there is an almost PERFECT correlation between incomes and economic growth. When wages rise, particularly when that increase is fast, it has preceded economic slowdowns.
With Q3 GDP dropping sharply, and Q4 unlikely to accelerate much, high wages will continue to pressure economic growth slower. As a consequence, employers will begin to reduce CapEx, employment, etc. in order to protect profitability. (Also why stock buybacks are at a record.)
Philly Fed
The came in below expectations at 23.8 down from 30.7 in October. However, the details were not as bad as the headline. , , and the 6-month outlook for all rose.
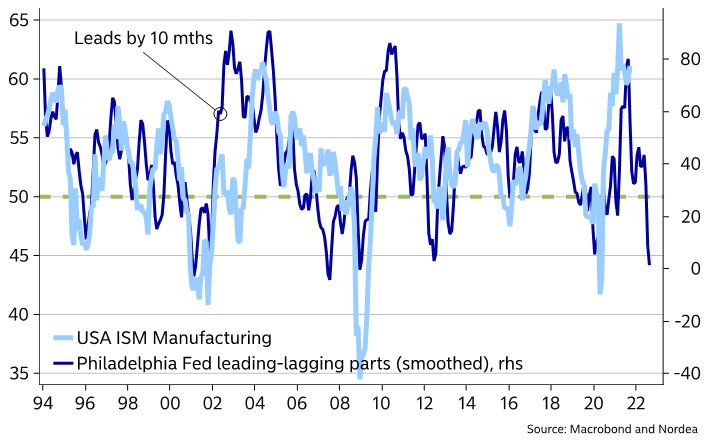
The index is composed of indicators that tend to lag economic activity and ones that lead economic activity. The graph below, courtesy of Nordea, shows how the difference between the leading and lagging indicators leads the broader index by about 10 months. As shown, the leading-lagging differential portends the index will fall back into economic contraction in the coming months. This chart affirms the sharp deceleration in growth currently being forecasted by the Atlanta Fed GDPNow.
Third Quarter Earnings Pageant Continues
$BITO is Not Perfect
Subscribers have asked our thoughts on the new ETF, the ProShares Bitcoin Strategy ETF (NYSE:) as a substitute for Bitcoin. The biggest drawback appears to be the cost structure is not as friendly as owning Bitcoin. First, the ETF’s management fee is 0.95%. Second, and this is a flaw with many commodity ETFs, holders pay to “roll” contracts. BITO is fully invested in the October Bitcoin futures contract. Accordingly, they will have to buy the November contract and sell October. Currently, the November contract is trading at a premium of 1.27% to the October price. If the futures curve remains steep, holders of BITO will pay 15% or more annualized to roll contracts. Including the management fee, BITO could underperform Bitcoin by nearly 20%. Obviously, that estimate will change based on the shape of the futures curve.
Oil CAPEX Declining
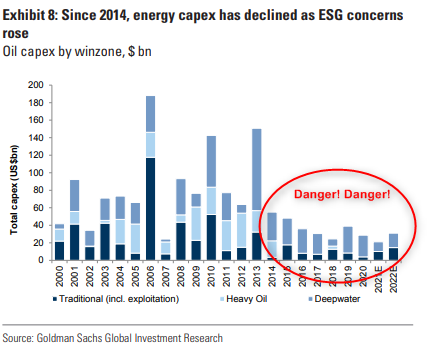
On Tuesday we shared a WSJ article that discusses the lack of investment in energy exploration (CAPEX). We just stumbled upon the graph below which shows the problem has been brewing for about five years. Political and economic incentives favor green energy, leading us to believe that unless prices stay at current levels or higher and can sustain such levels, there is little reason to expect investment to pick up.
Energy Capex


