It was a pretty brutal day, with the falling 1.7% and the s down 2.2%. The headlines talk about the risk of Evergrande and China, but that is just a reason to sell. It was a significantly overheated market, juiced up on high margin levels and extreme valuations. As the Fed is likely to begin tapering down QE, it should lead to tighter financial conditions, which means less margin will be available and lower PEs. Not to mention China’s economy is slowing, as is the US. That will likely spill into an earnings revision cycle lower. Nothing has changed from what I have written about for months in slow motion as it was happening.
VIX
Despite the significant drop, it could have been worse if not for a rally, lifting the S&P by 1.2% in the last thirty minutes. The end-of-day rally had more to do with the melting and fueling the move up.
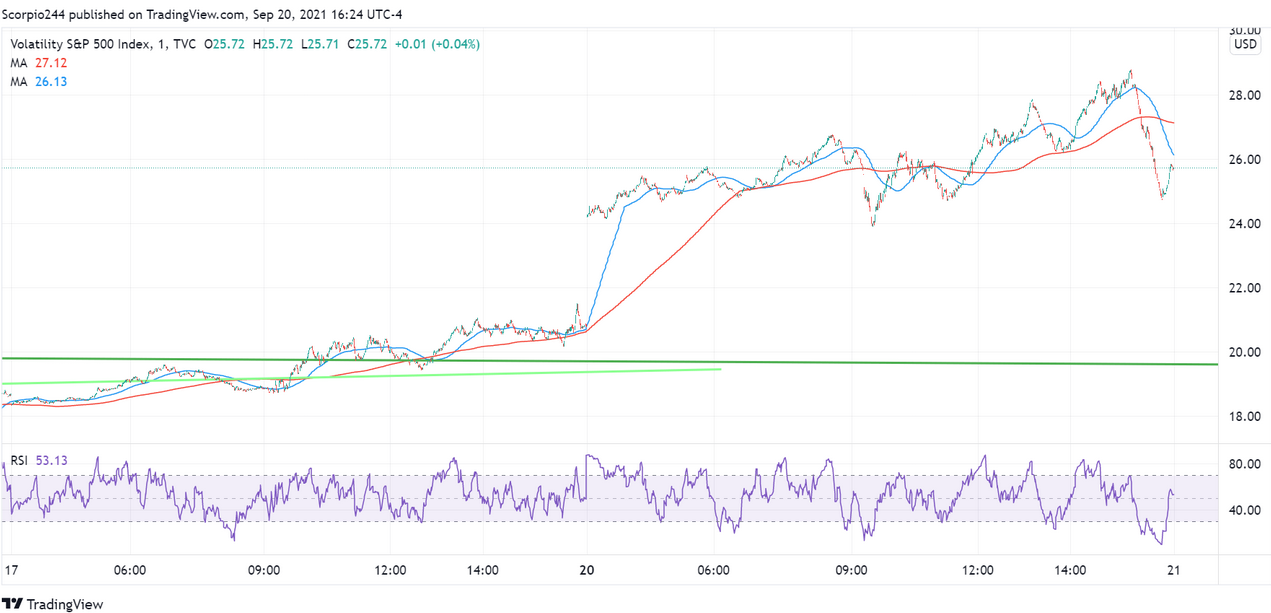
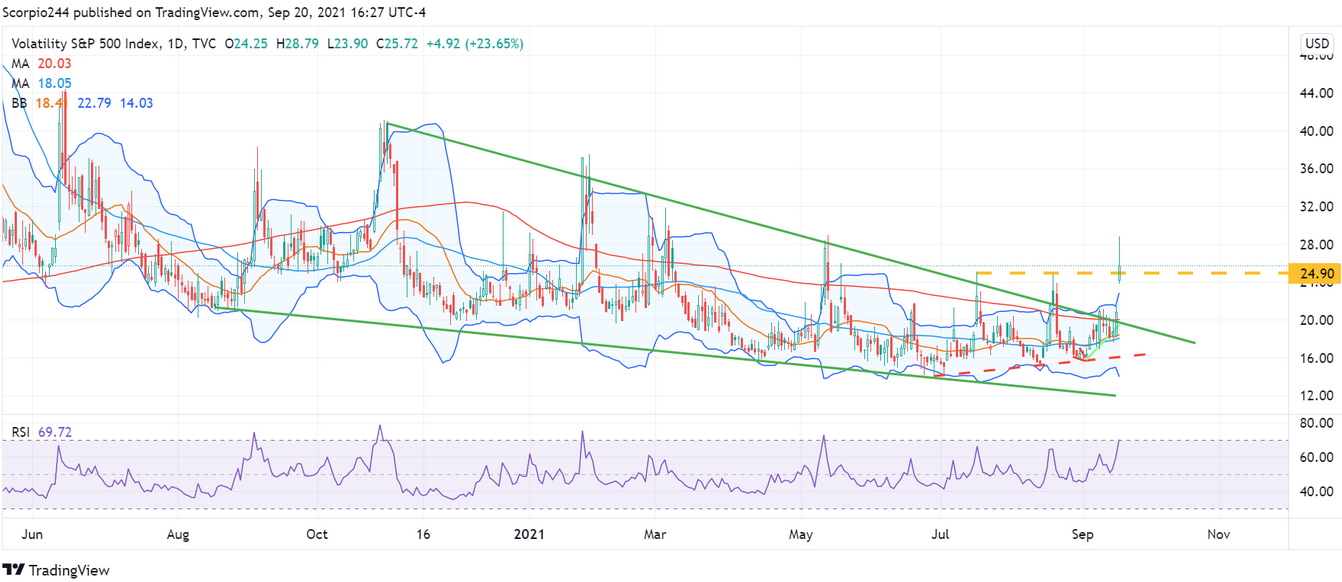
The VIX broke out of the falling wedge today and cleared the previous highs of July and August. It is rather notable as it is the first time the VIX has made a higher since November 2020. The VIX may go higher over the next two days as investors worry about the Wednesday afternoon FOMC . One would think there would be an absence of volatility sellers over the next two days, which will keep the VIX elevated and not allow the S&P 500 to have that reflexive bounce back.
S&P 500
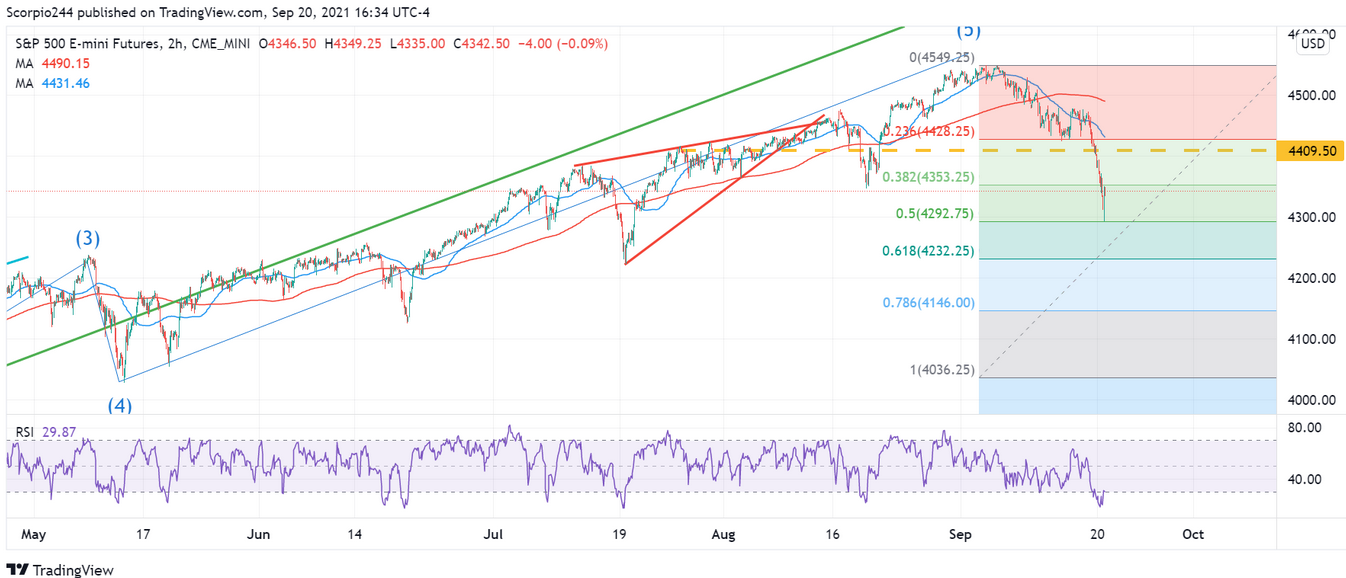
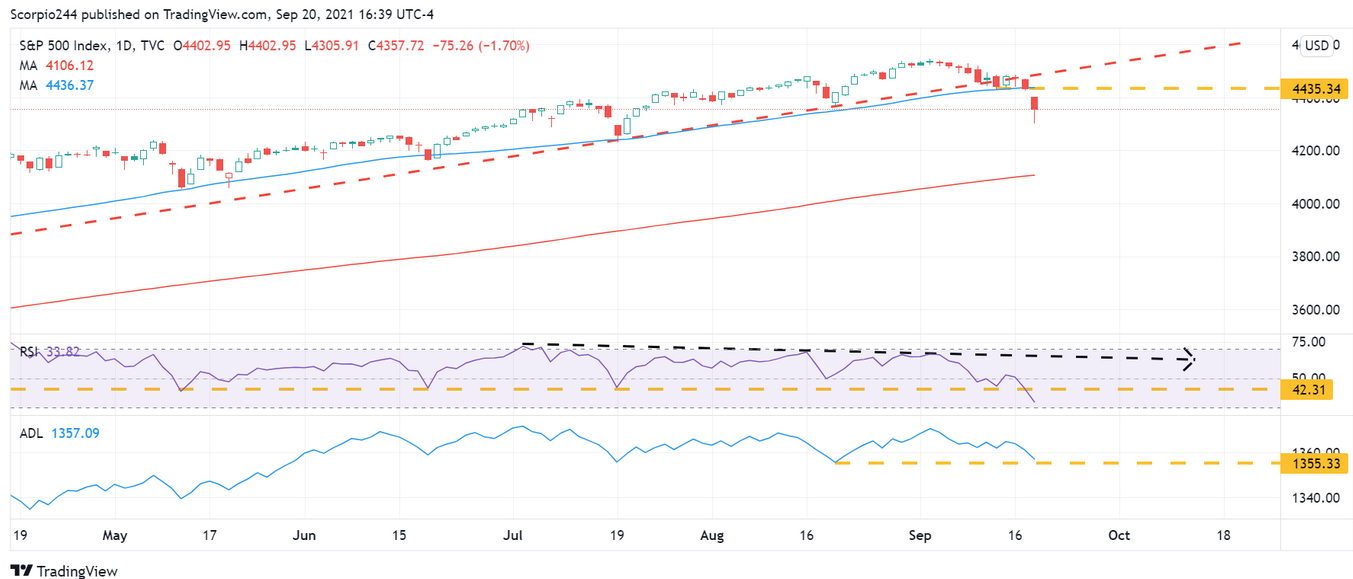
The futures managed to fall to the 50% Fibonacci retracement level of wave five and bounce. It likely does not mark the end of the decline and probably just one part of the move lower, of what could be a wave one down.
One can see on the daily chart how we are now firmly below the 50-day moving average and below the uptrend that started in October of last year. I would consider it a lousy indication and could set up a drop to the 200-day moving average region in the not-too-distant future. Many significant markets worldwide are testing or near testing that essential moving average, and I don’t see why the S&P 500 would be immune.
NASDAQ 100
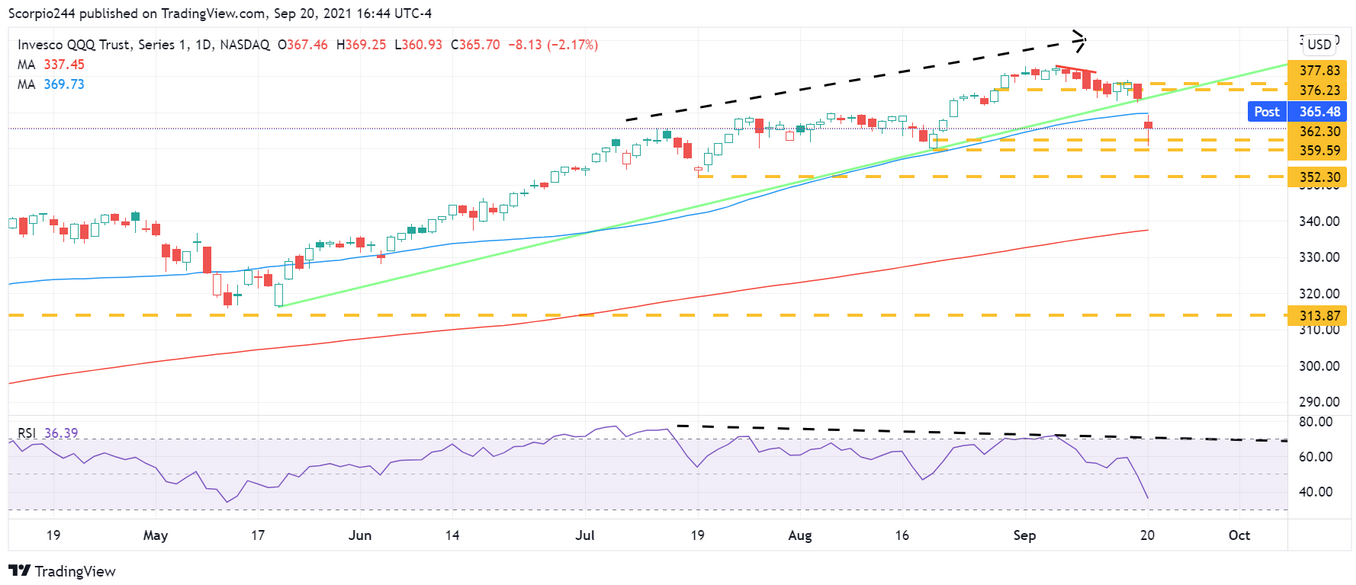
The Qs also broke a significant uptrend today by gapping under it, something you don’t want to see.
Apple
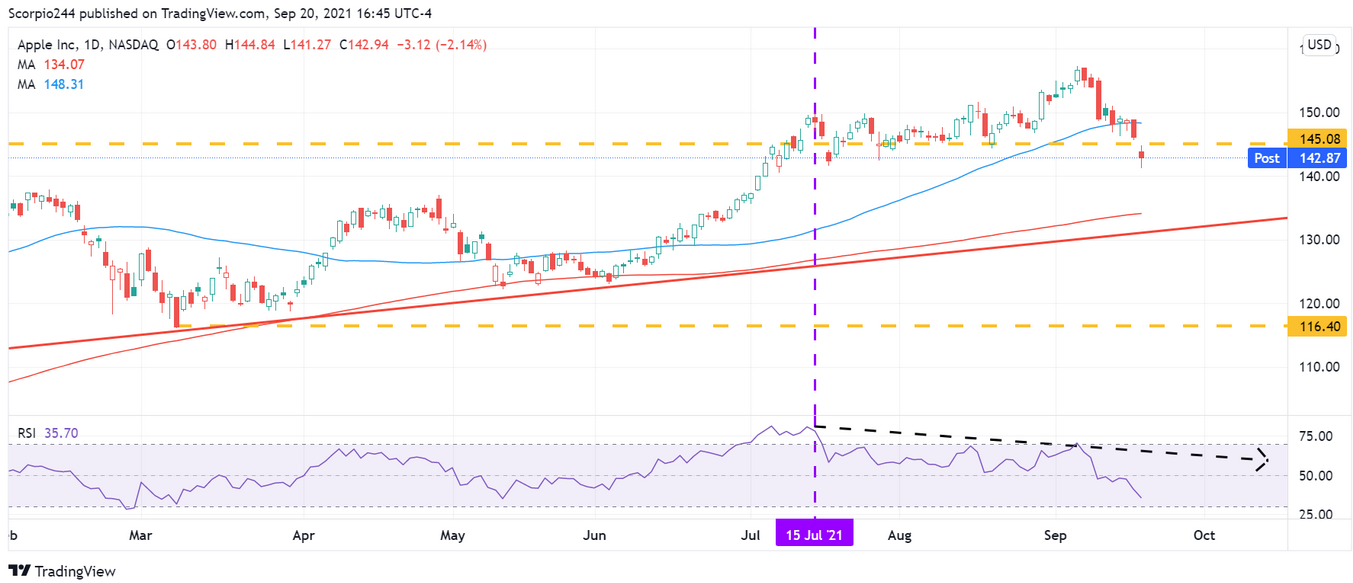
Apple (NASDAQ:) fell 2% today, and it too gapped below a significant level of support at $145. I have been looking for Apple to drop to around $130, and it seems like that process may finally be starting.
AMD
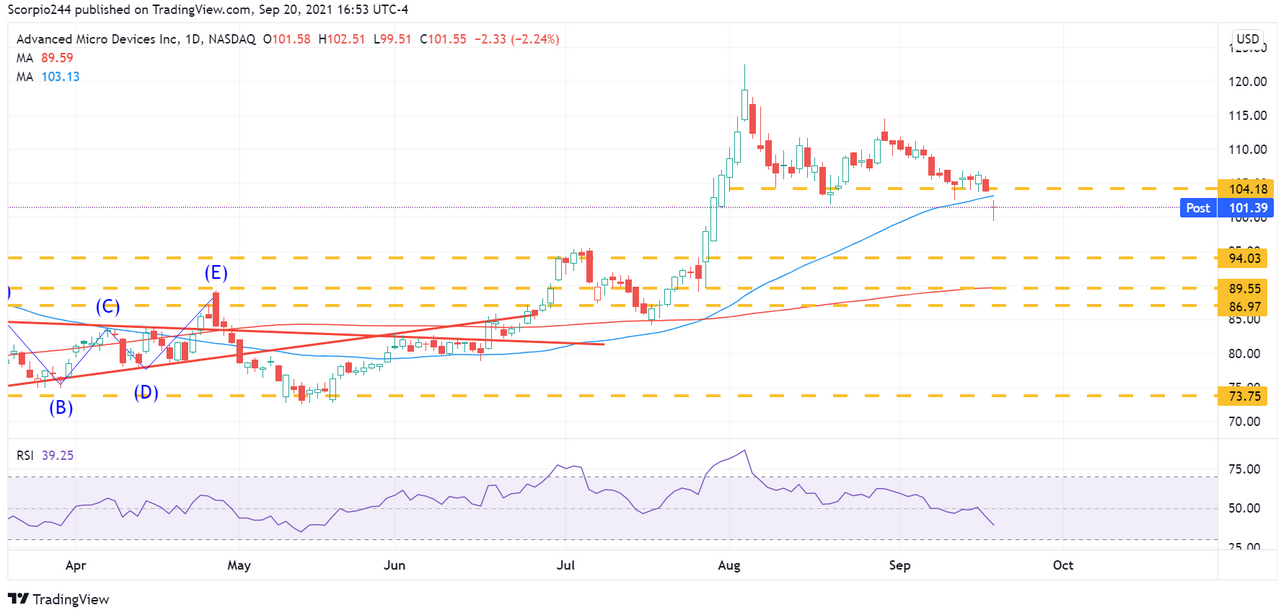
Advanced Micro Devices (NASDAQ:) fell pretty hard today too, and it also gapped below significant support at $104. The RSI tells us the drop isn’t finished yet, with the potential to revisit $94.
Caterpillar
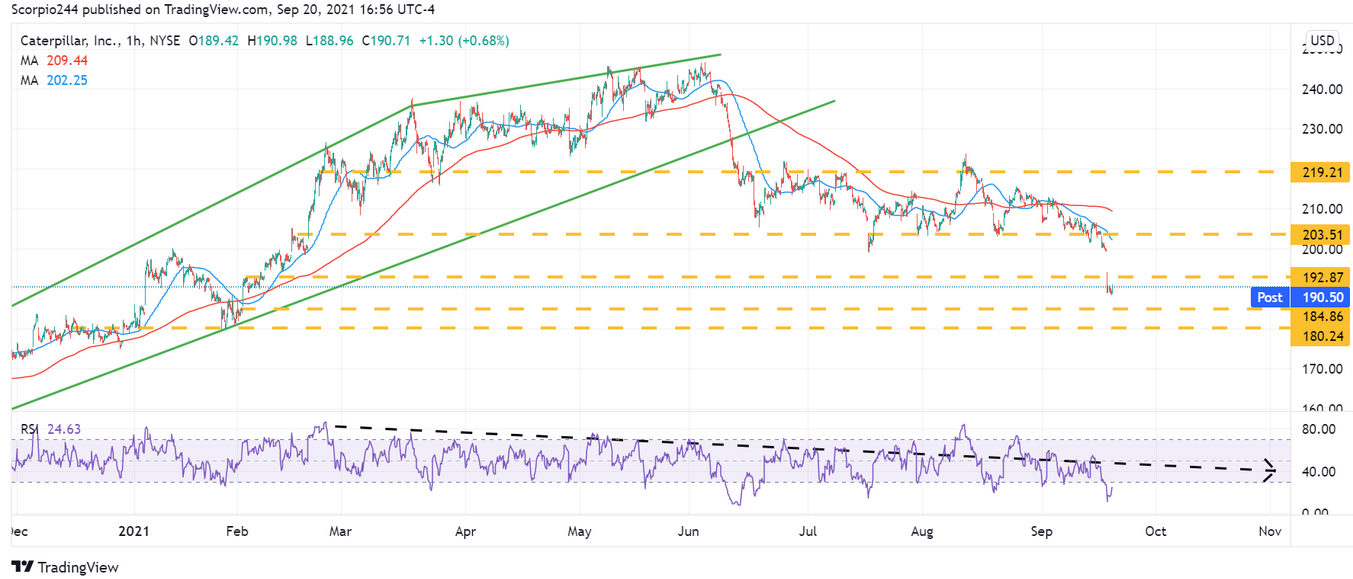
If there is one thing I remember from the trade-wars of 2018 and 2019, Caterpillar (NYSE:) is a proxy for China, and it acted like it today. The stock gapped below support at $192, and now that is likely to act as resistance as the shares head towards $184.
Unity
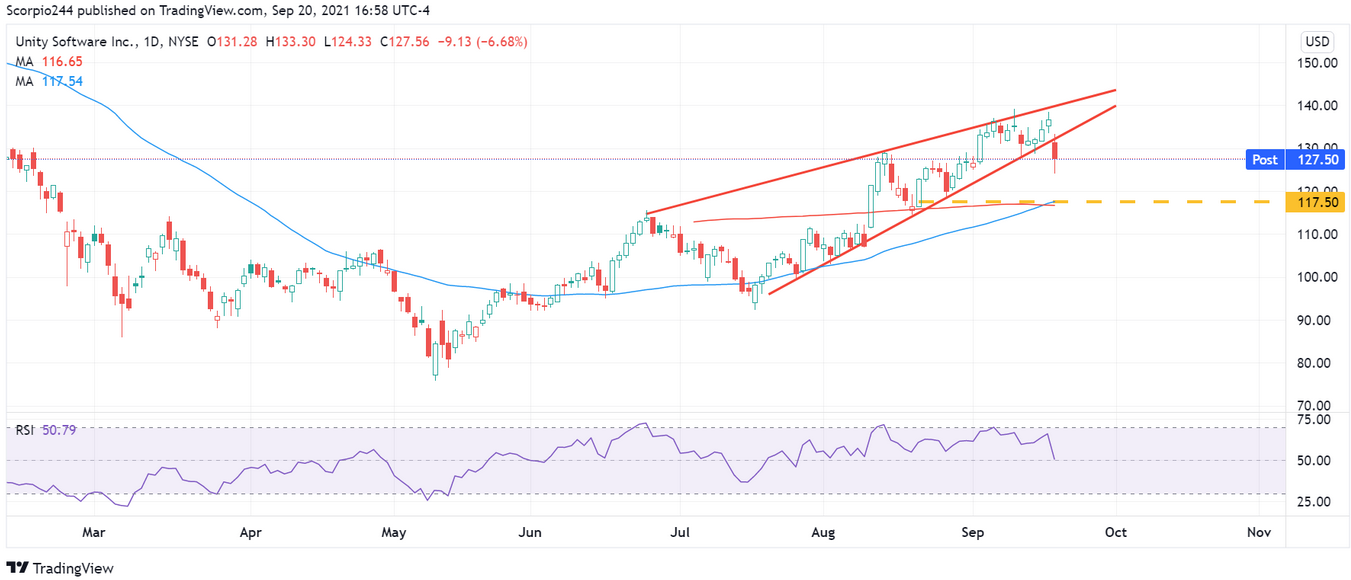
Finally, Unity fell out of its rising wedge today, which could be the start of something further, as mentioned in a story last week, with the potential for the shares dropping to $117.


