Stocks barely rose on December 30, and at this point, nothing eventful is likely to happen today. There is always a chance something happens, but I think people are just more than happy to wrap this year up and move on.
I guess we have to ask ourselves, what’s next? More stimulus? Maybe. At some point though, too much stimulus will not be a good thing for the equity market.
S&P 500 (SPY)
The S&P 500 still has a gap down around 3,700 that needs to be filled from Monday’s opening. It will not surprise me if that gap gets filled today. A rising wedge pattern has formed over the past few days on the hourly charts, and that would suggest lower prices come on Thursday.
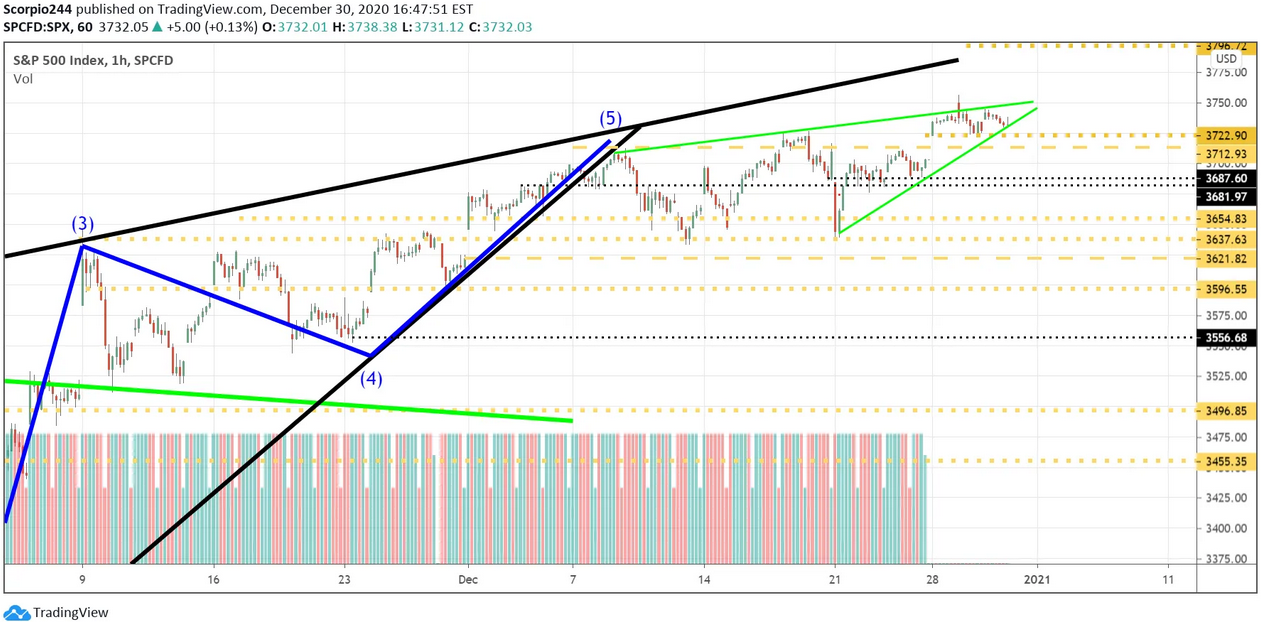 S&P 500 Index 1-Hr Chart
Russell (IWM)
The IWM doesn’t look great, it broke a massive uptrend, and you can see the RSI is fading pretty fast. But what is more interesting is that of the top 10 holdings of this fund that tracks the Russell 2000, two are among the most shorted, based on data from Refinitiv. Plug Power (NASDAQ:PLUG) and Novavax (NASDAQ:NVAX). I find it interesting because the most shorted index has clearly outperformed everything this year; it nearly overtook the NASDAQ 100.
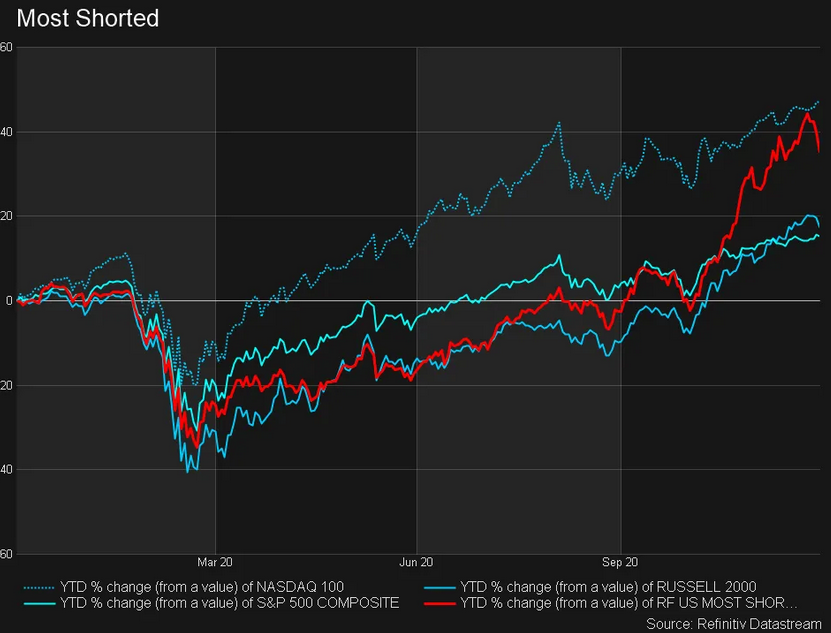 Most Shorted – YTD Chart
We have reviewed the price action for the last couple of weeks in the subscriber section on Sundays. I added a spreadsheet that has a list of the tickers as well. So I will try to get some more data to compare. Of course, it doesn’t say much about the quality of the index at this point that 2 of the top holding ten are among the most shorted in the market. It certainly could help to explain why Russell has soared so much.
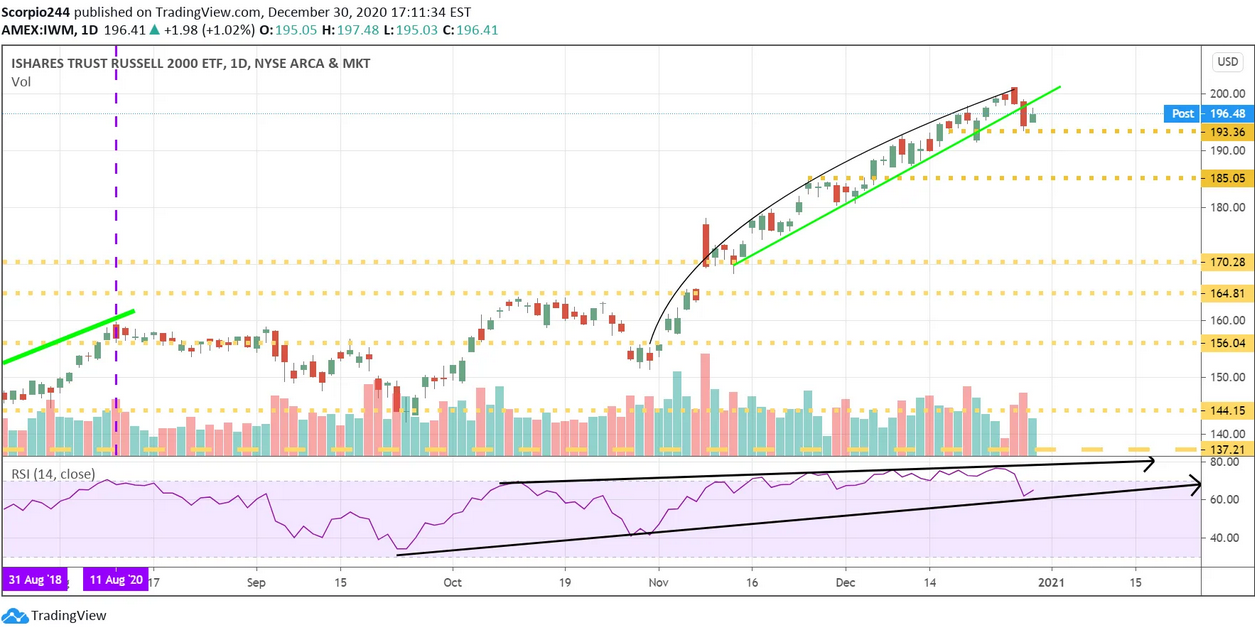 IWM Daily Chart
Tesla
Tesla (NASDAQ:TSLA) had quite the day on Wednesday, rising back to $695; of course, it stopped right around there, bringing out the double top people. It looks more like an ascending triangle then a double top. Momentum is still bullish, and if I projected things right, a break-out at $695 sends the stock higher towards $730. Of course, we should get Tesla’s delivery numbers over the weekend.
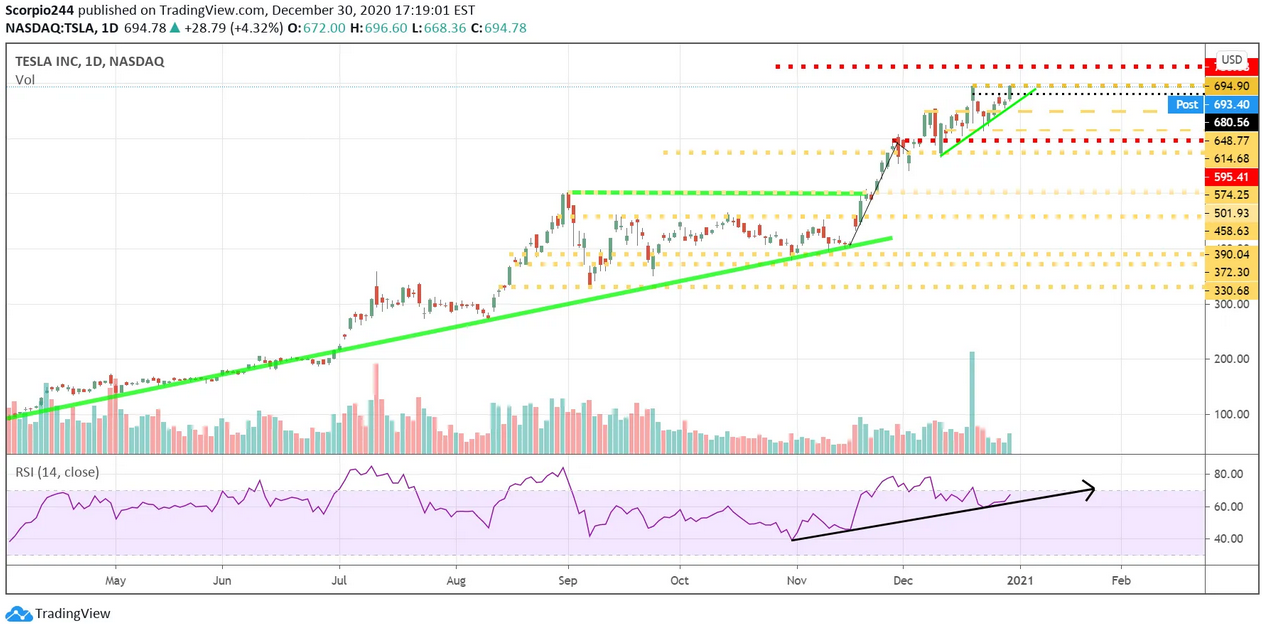 Tesla Inc Daily Chart
Alphabet
The Alphabet (NASDAQ:GOOGL) chart doesn’t look too encouraging, with a potential head and shoulders pattern forming. I certainly hope not, since I own the thing. Unfortunately, we won’t find out until it falls below $1700.
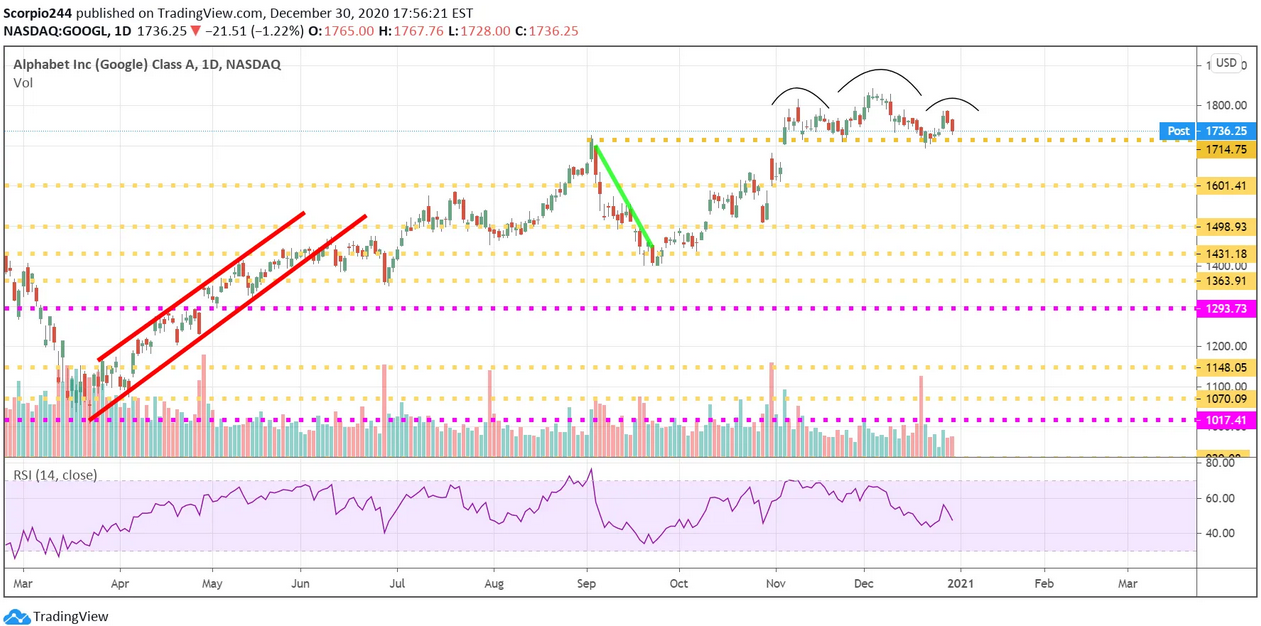 Alphabet Inc Daily Chart
Facebook (NASDAQ:FB) fell below the bottom of the triangle, and it looks like it may have confirmed that bearish pattern yesterday. If it is confirmed, then $259 is likely the next stop, potentially worse than that to follow.
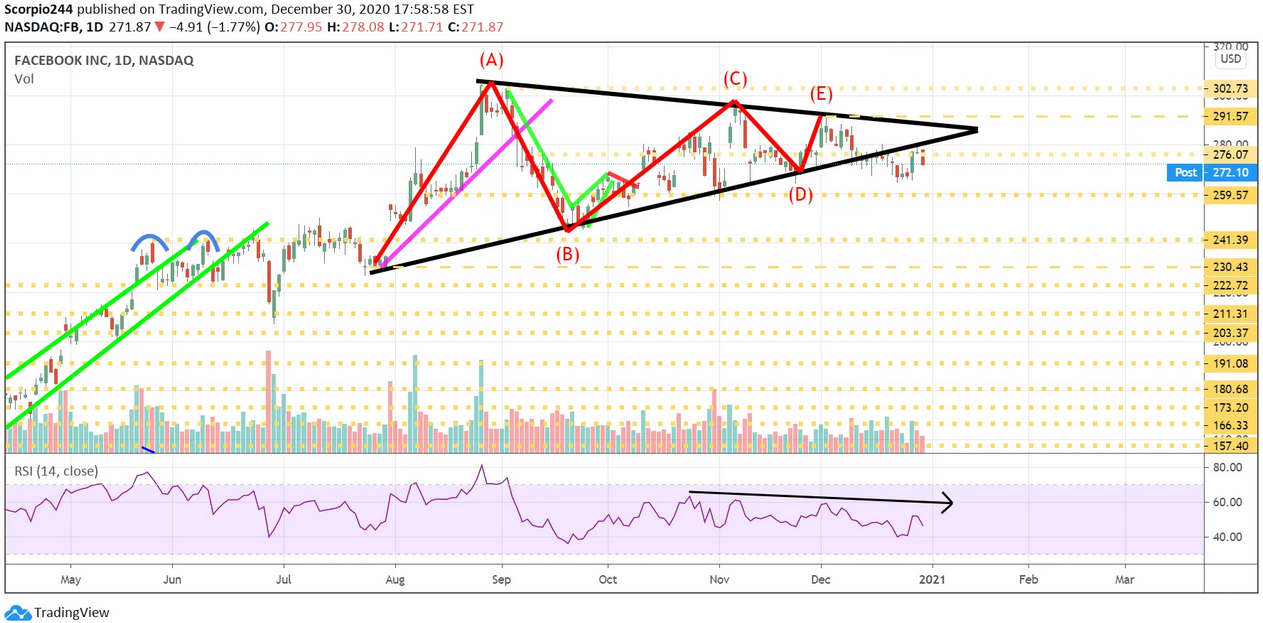 Facebook Inc Daily Chart
AT&T
AT&T (NYSE:T) may be heading lower, too, with that giant gap left to fill around $27.50. I explain it in this story in more detail.
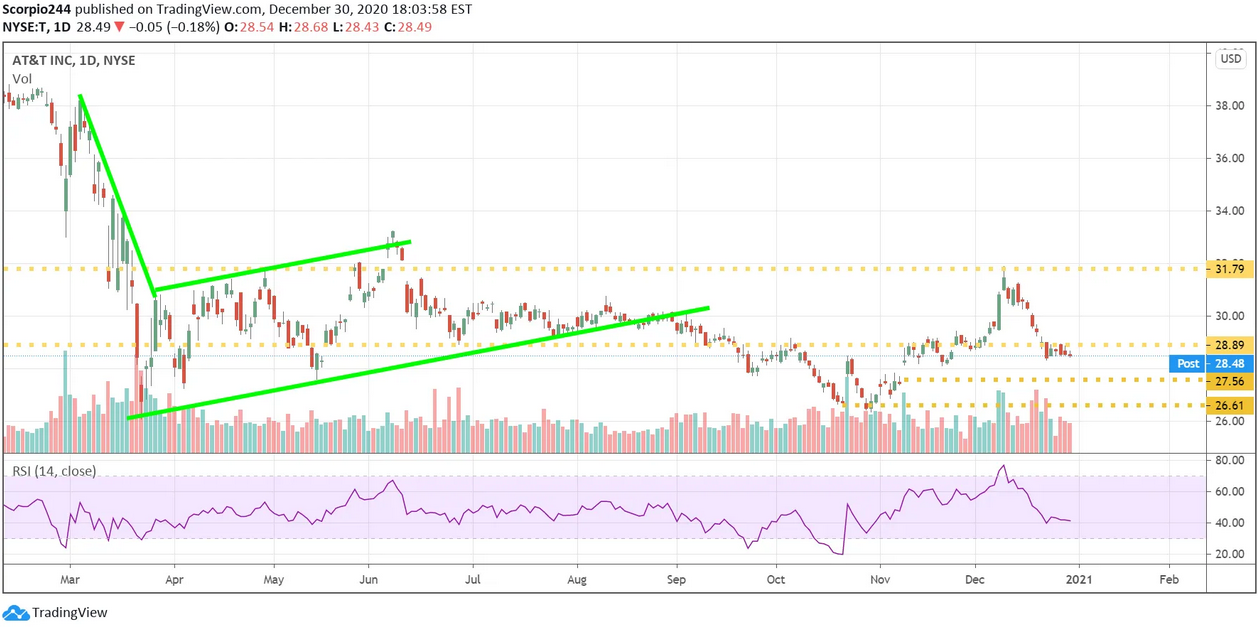 AT&T Inc Daily Chart
General Electric
General Electric (NYSE:GE) looks somewhat interesting with a potential bull flag and a chance another meaningful leg higher. I will have to look more closely later today.
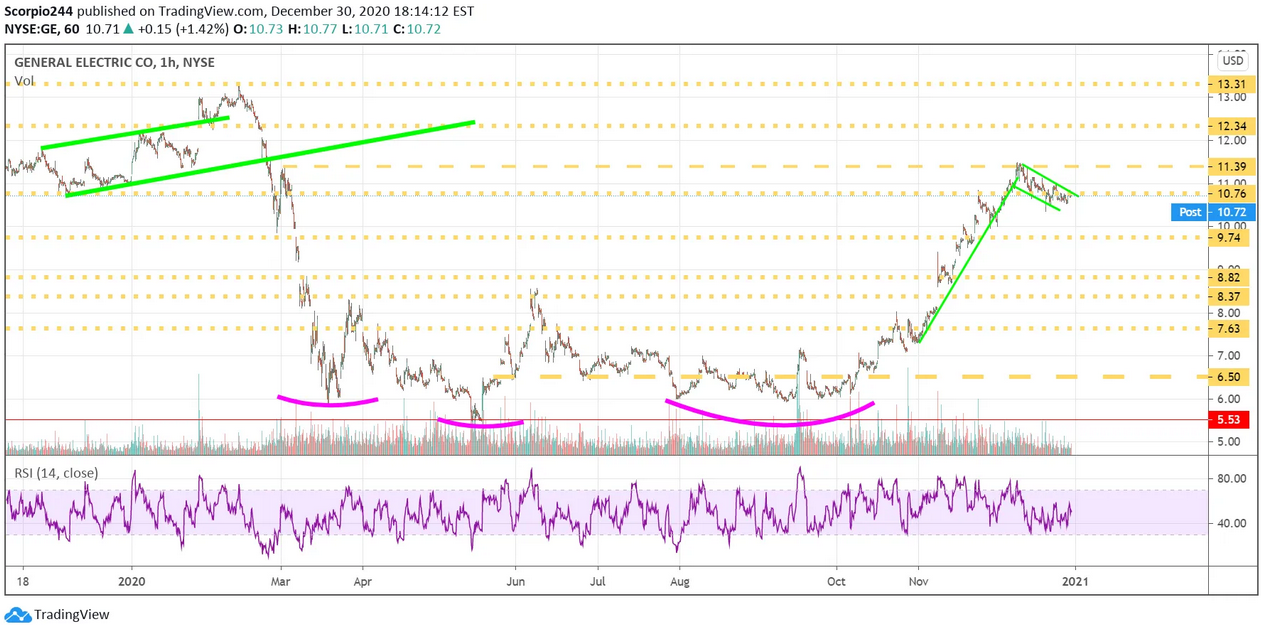 General Electric Co 1-Hr Chart
