Stock bulls aren't yielding an inch of ground, and technically they have precious few reasons for doing so. Standing in the way of a strong bull market isn't really advisable. With the S&P 500 at new highs, and the anticipated slowdown in gains over Friday, where is the momentary balance of forces? As the proverbial rubber bands gets pushed upwards still, what about those rising probabilities of seeing at least a short-term pause in the stellar pace of gains since last Monday?
Let's dive into the charts (all courtesy of www.stockcharts.com).
S&P 500 Outlook And Its Internals
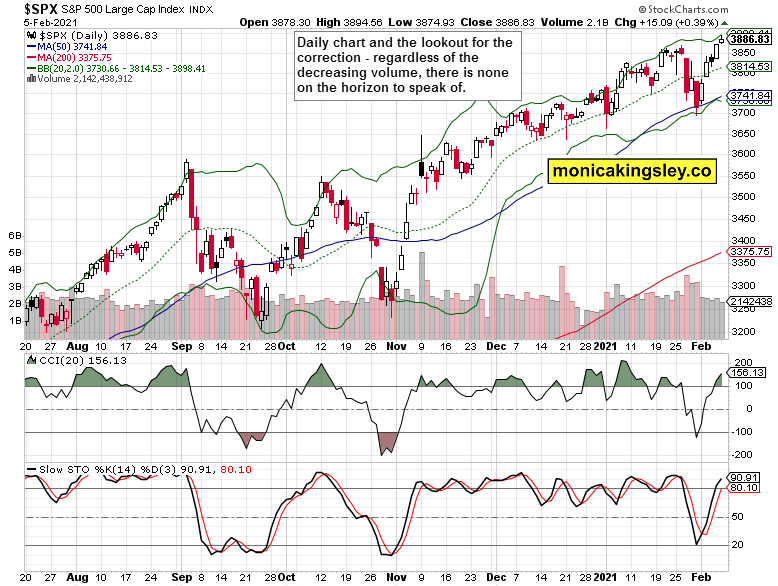 S&P Daily Chart.
Stocks keep pushing higher, and the bulls are strong regardless of the little contraction in the daily volume. The daily indicators attest to the strength of the uptrend, but the pace of daily increases looks set to slow down as minimum though.
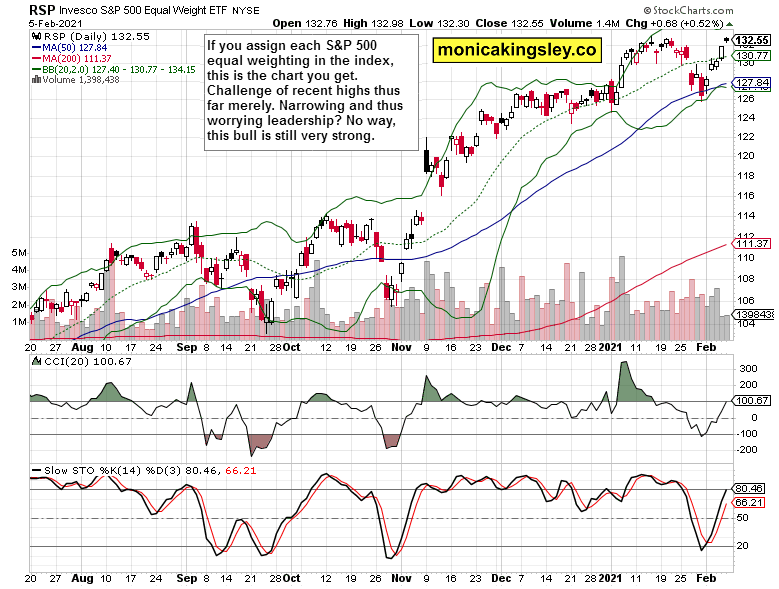 RSP Daily Chart.
Imagine that all the constituent shares in the S&P 500 had equal weight (i.e. forget about $NYFANG) – this is the chart you get. Invesco S&P 500® Equal Weight ETF (NYSE:RSP) ETF is only now challenging its highs, which is however not a disappointment or a red light flashing divergence at all. The march to new highs in the S&P 500 still looks satisfactorily broad based.
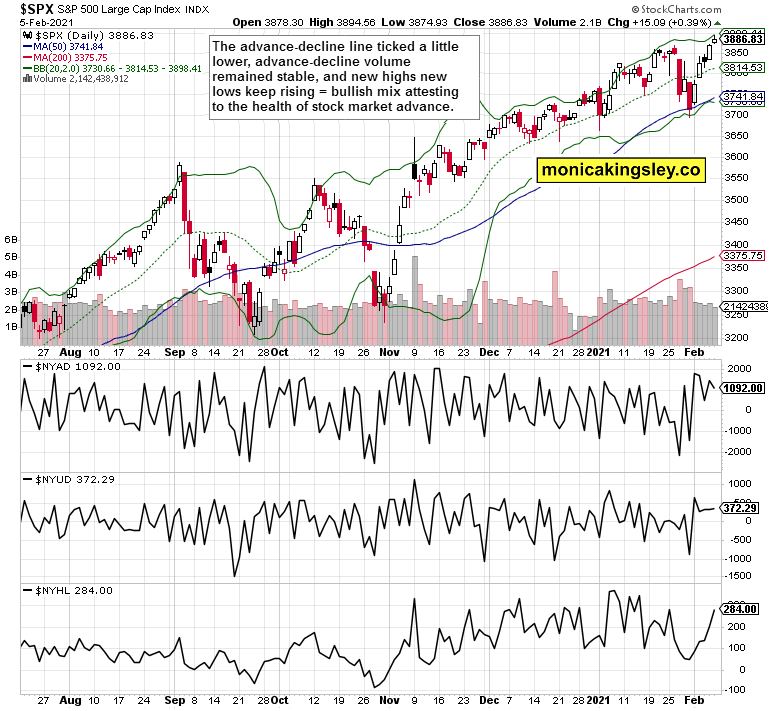 S&P 500 Daily.
Market breadth confirms that very clearly. Both the advance-decline line and advance-decline volume aren‘t disappointing in the least, and new highs new lows have made a strong comeback from preceding setback. The intermediate picture is one of strength.
Credit Markets and S&P 500 Sectoral Ratios
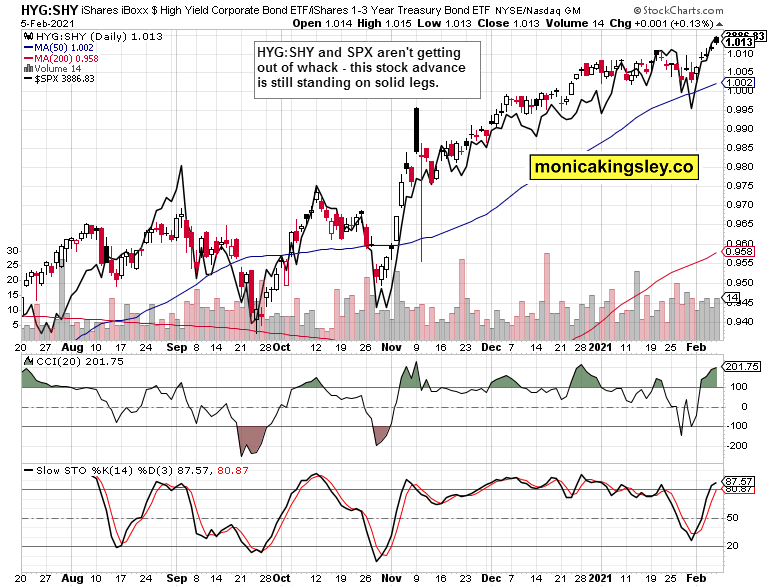 HYG-SHY Ratio.
High-yield corporate bonds to short-term Treasuries (HYG:SHY) ratio with S&P 500 overlaid (black line) shows that the two are tracking each other tightly in recent days. Stocks haven‘t yet yielded in their attempt at taking leadership position, regardless of their performance since the start of November (which makes the attempt suspect in the very short-term, as stocks have lagged a little relative to the credit markets back then). Bearish prospects? No way, dips are still to be bought.
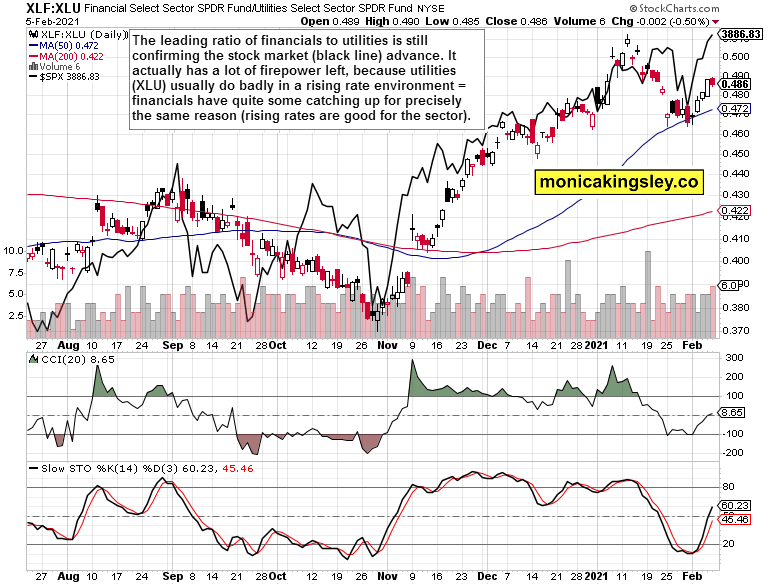 XLF-XLU Ratio.
The financials to utilities (XLF:XLU) ratio still broadly supports the stock market advance. Looking at the bond market dynamics, I expect utilities to remain under pressure, while financials would gain faster. I‘m not worried by the current relatively depressed ratio's value, and don‘t consider it a warning sign for the S&P 500 in the least.
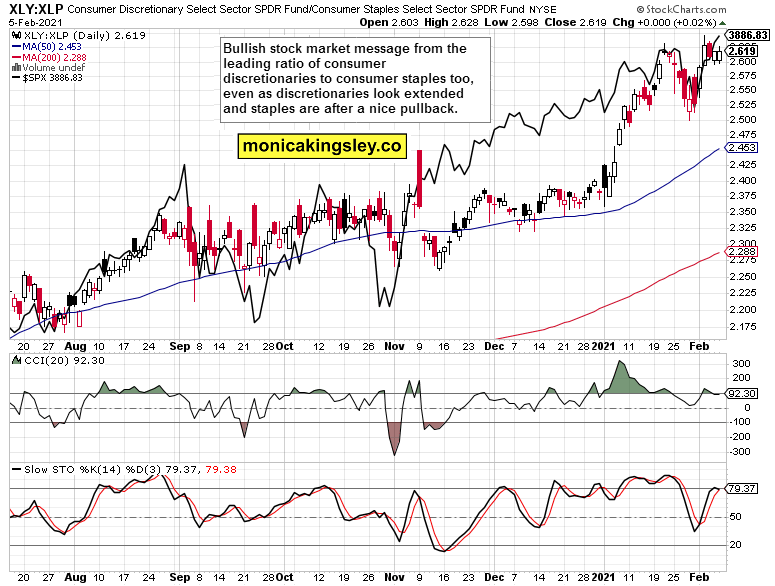 XLY-XLP Ratio.
Consumer discretionaries to consumer staples (XLY:XLP) is another leading ratio worth watching. It‘s currently at quite elevated levels, as I view the discretionaries as extended, while the staples have undergone an appealing pullback. Even though that makes for short-term headwinds in the ratio, it's still primed to support the stock market bulls.
Summary
The stock market keeps powering higher, and despite the rather clear skies ahead, a bit of short-term caution given the speed of the recovery and its internals presented, is in place. I wouldn't be surprised to see today or tomorrow a brief and weak whiff of lower prices – nothing to call home about if you were a bear, that is.
Leave a comment