Stocks managed to finish mostly higher yesterday, with the climbing about 30 basis points and the 's climbing by around 35 bps. The S&P 500 managed to finish the day just over 3,700.
There isn’t a lot of news driving these markets at this point, just some headlines around stimulus. That lack of newsflow seems to allow some gambling to occur, which is squeezing some of the already overvalued stocks to push higher. There is nothing fundamental about these moves up in stocks like Roku (NASDAQ:) or Snowflake (NYSE:), or any others. It isn’t that these can’t be a great one or have a niche; the valuations they have achieved are just mind-blogging.
Here is a chart of the market cap of the S&P 500 to the US along with GDP and the Fed balance sheet. It is pretty stunning to see just where we are currently.
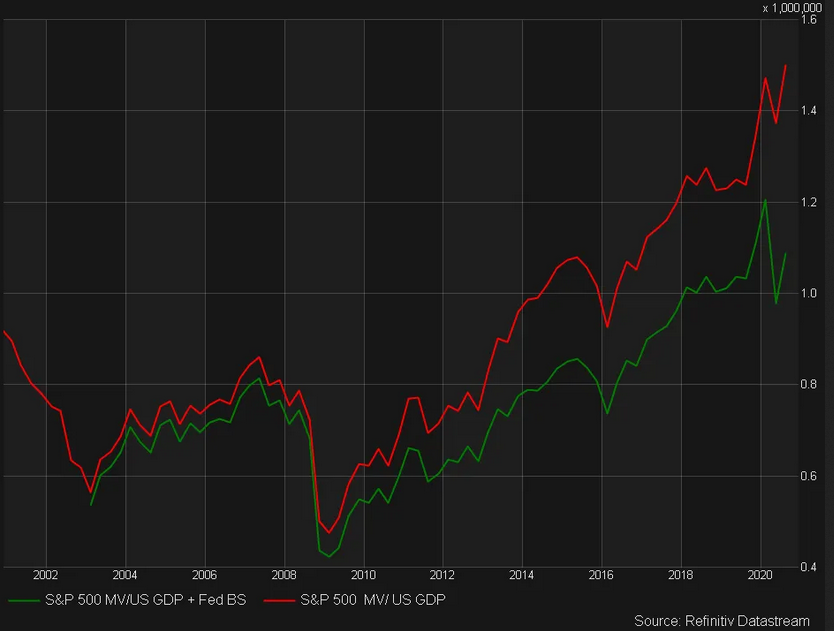 S&P 500 Chart
S&P 500
The S&P 500 finished outside of the rising wedge pattern we have been tracking. We are left to figure out where the index goes next, and while it is impossible to be certain, it would seem to me, that the next stop for this index will be 3630, and then likely lower from there.
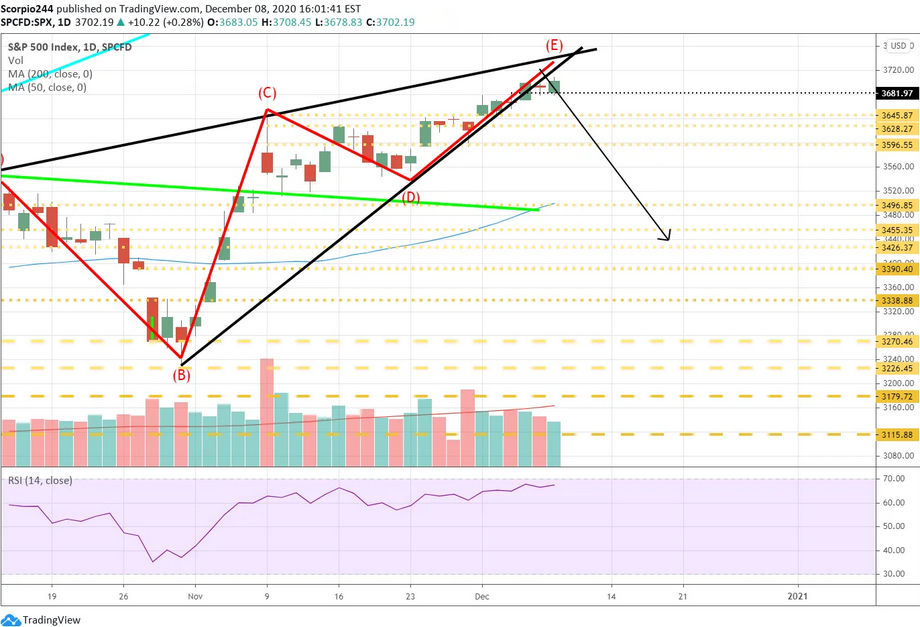 S&P 500 Index Daily Chart
NASDAQ
The Qs managed to finish with an RSI above 70 today. Volume continues to fall, which again suggests buying interest up is slowly grinding to a halt. These are negative signs in my opinion.
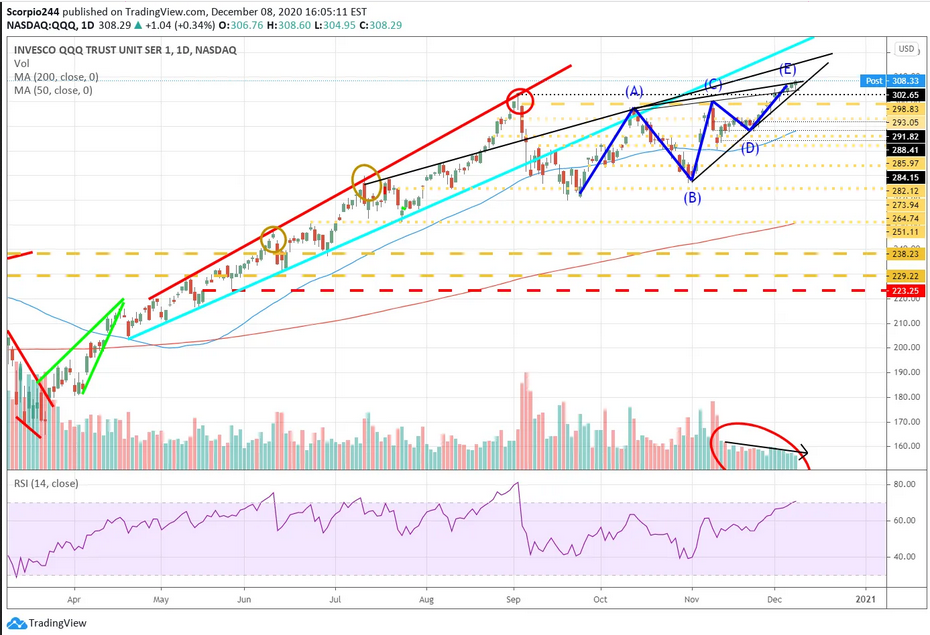 QQQ Daily Chart
Snowflake
Snowflake is one example of what I think may have been a convexity squeeze gone bust. Yesterday, the stock was up nearly 10% today at one point but gave that all back to finish the day flat. Pretty startling event. Options volume has been pretty heavy the last few days, and that sent implied volatility levels higher along with the stock. Generally, speaking when we see this happening a convexity squeeze is taking place, and those never end well. A drop below $383 sets up a drop to around $342.
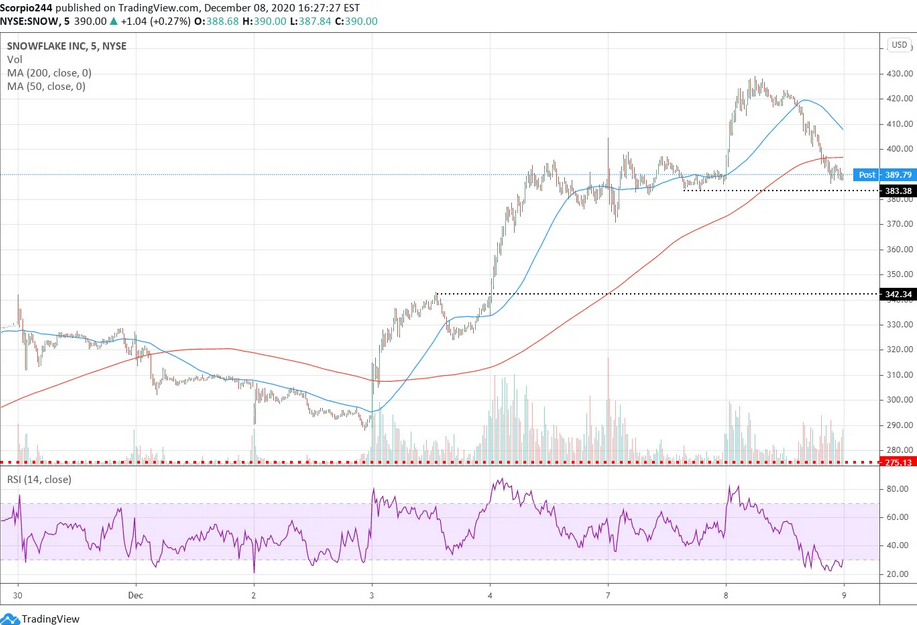 Snowflake Inc Chart
Tesla
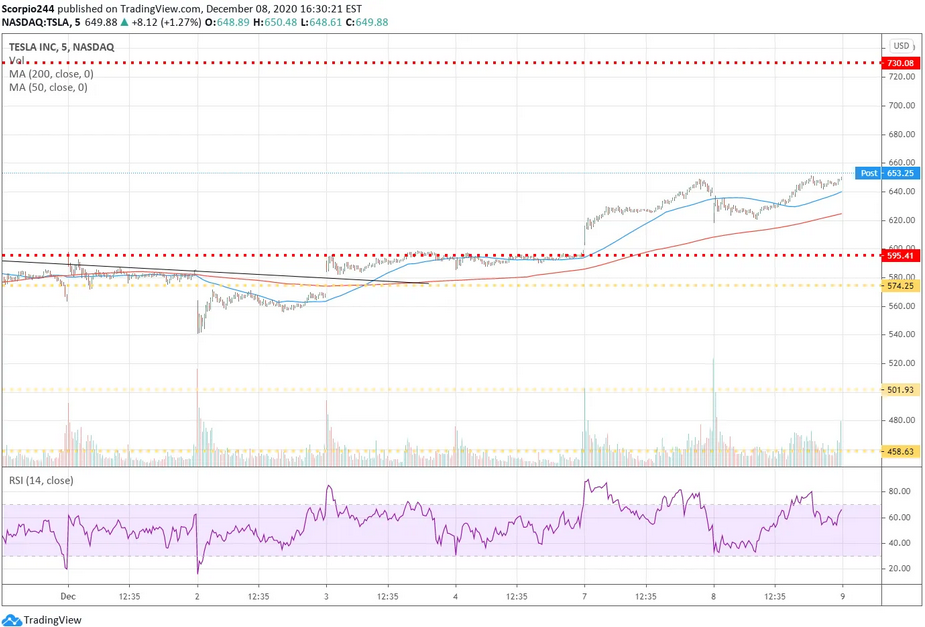
Tesla (NASDAQ:) started the day lower on news of another $5 billion equity raise. The stock managed to finish the day higher, and closing above resistance at $650. I still have resistance marked off at $730.
 Tesla Inc Chart
Broadcom
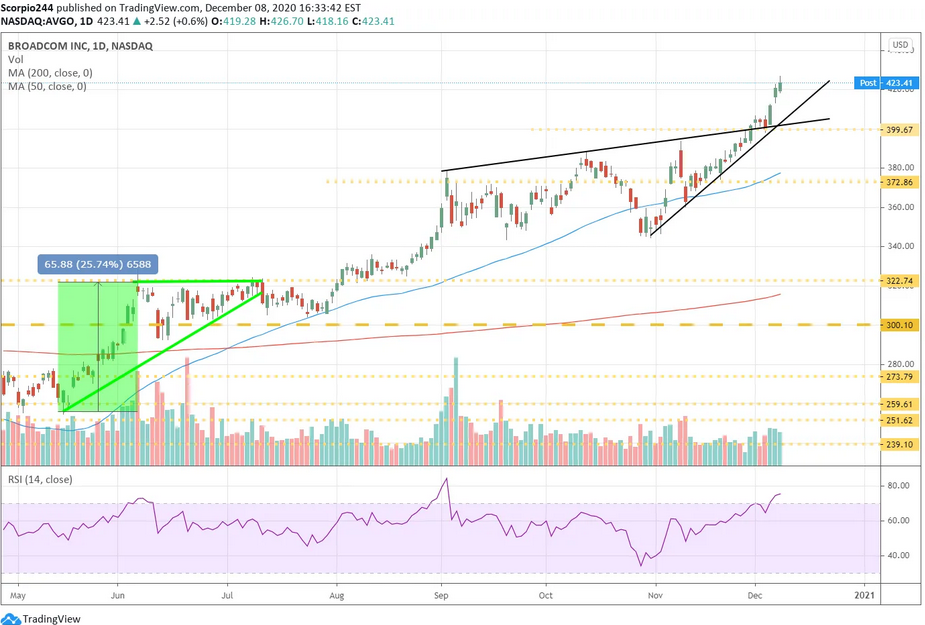
Broadcom (NASDAQ:) will report results on Thursday after the close. The stock has been rising ahead of those results. I still tend to think this stock is ahead of itself and is due for a post-earnings sell-off back to around $372.
 Broadcomm Inc Daily Chart
Altria
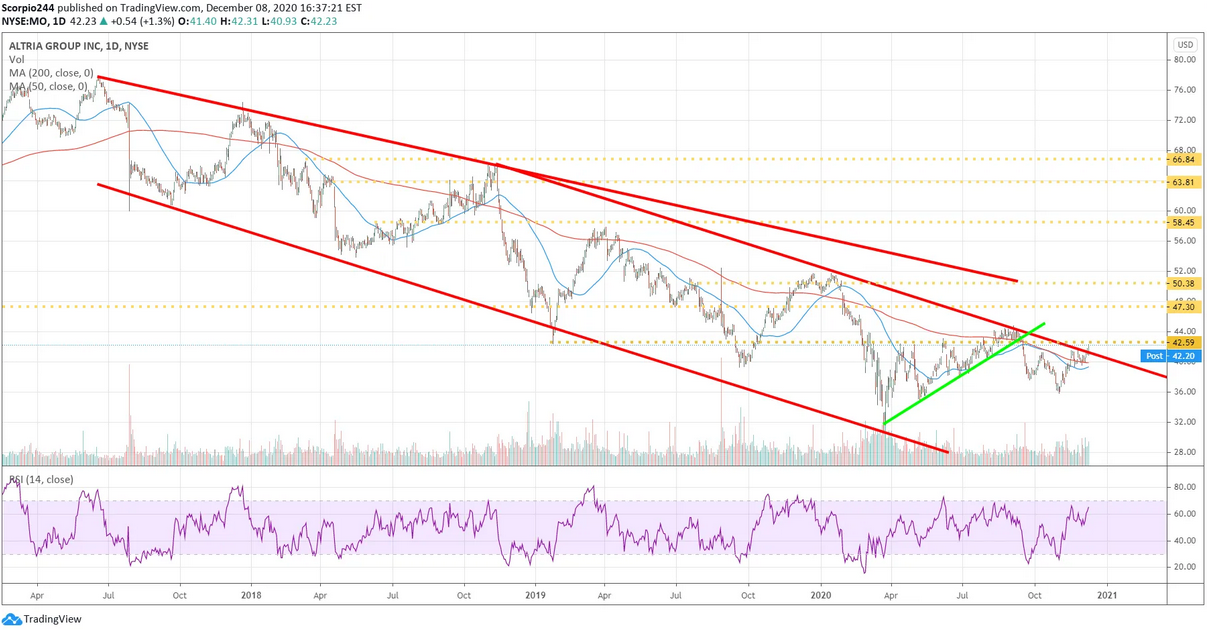
It looks like Altria (NYSE:) may finally be breaking out of this horrific downtrend, and if manages to get beyond $42.60 it likely climbs to around $47.30.
 Altria Group Inc Daily Chart
