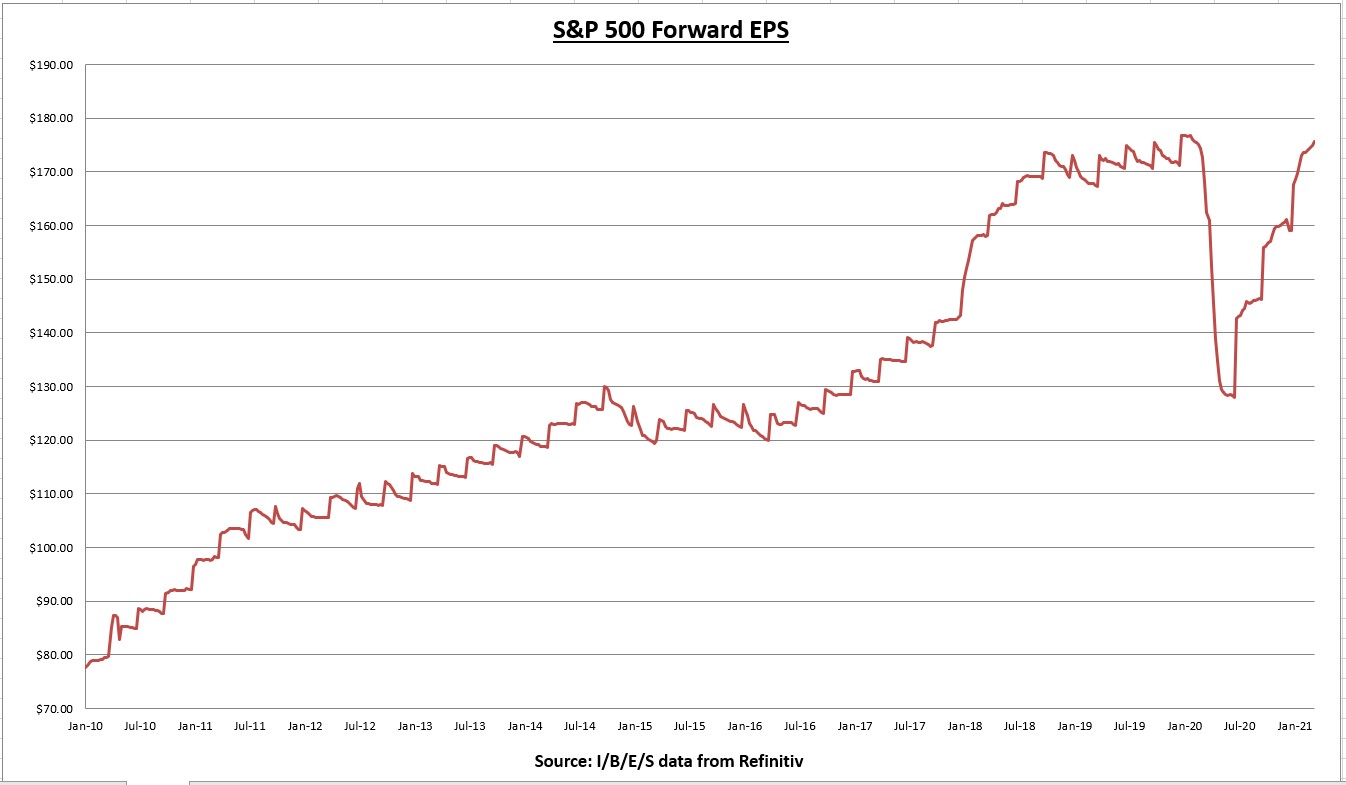
The earnings per share (EPS) for all S&P 500 companies combined increased to $175.60 last week. This represents a gain of 0.39% for the week, and a gain of 10.43% for the year to date.
 S&P 500 Forward EPS Chart
The forward EPS is less than 1% away from all-time highs and I expect a substantial increase when we roll into the new quarter.
 SPX Weekly Chart
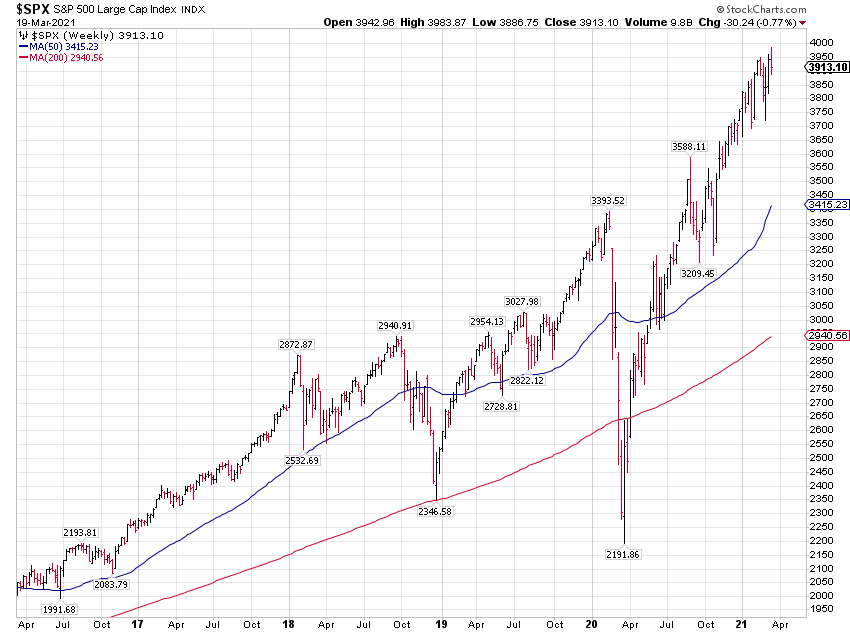
The S&P 500 declined 0.77% last week.
 S&P 500 Forward P/E Ratio Chart
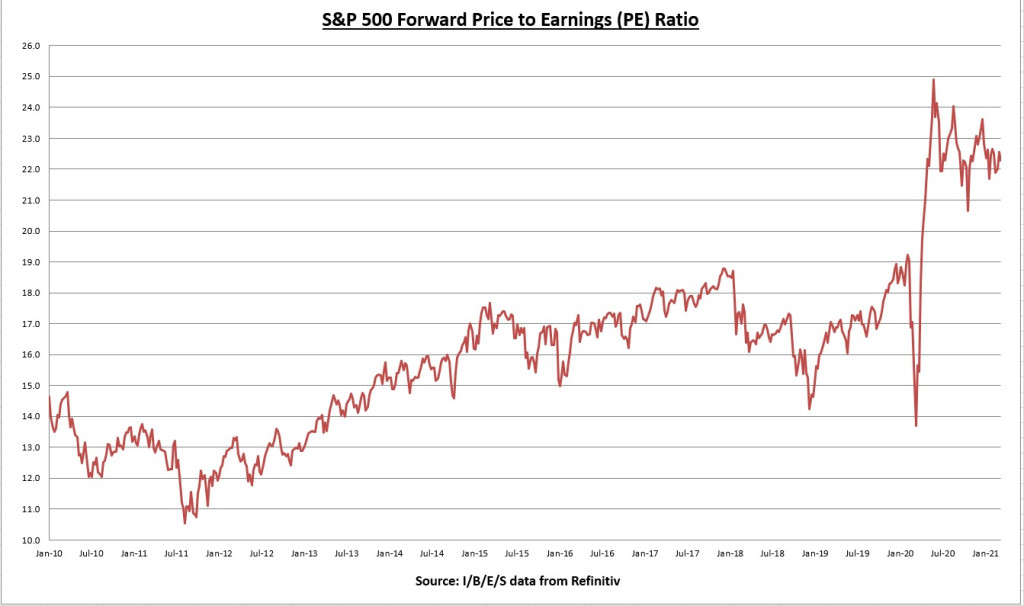
The price to earnings (PE) ratio declined to 22.3.
 S&P 500 Earnings Yield Vs 10 Yr Treasury Yield Chart
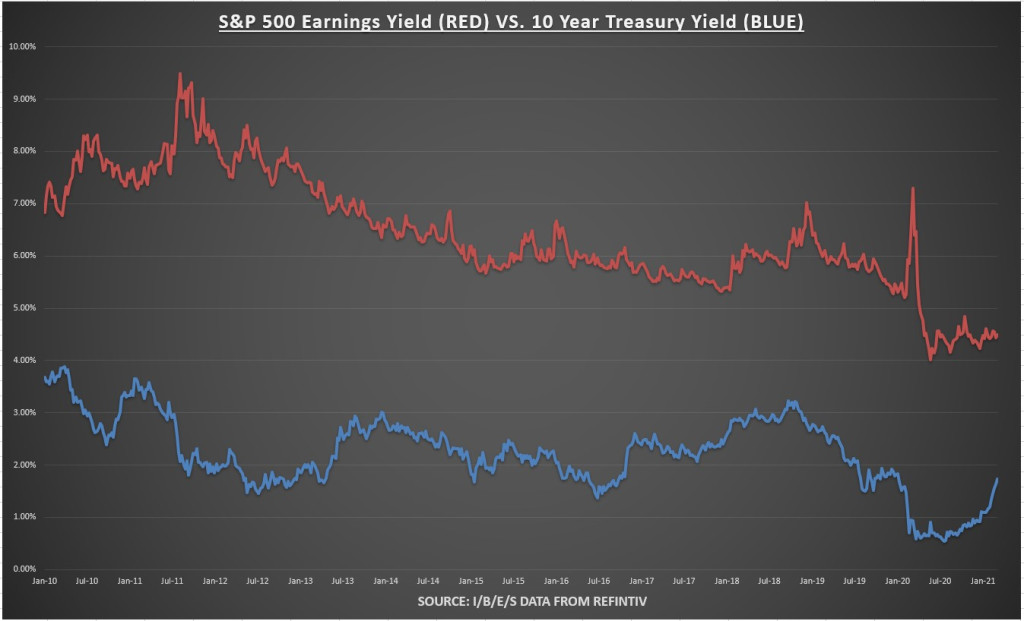
The earnings yield on the S&P 500 is now 4.49%, while the 10-year Treasury bond rate increased for the 8th straight week in a row, reaching 1.73% as of this writing. The valuation gap was narrowing, with the equity risk premium falling to 2.76%, but still favoring stocks convincingly.
Economic data review
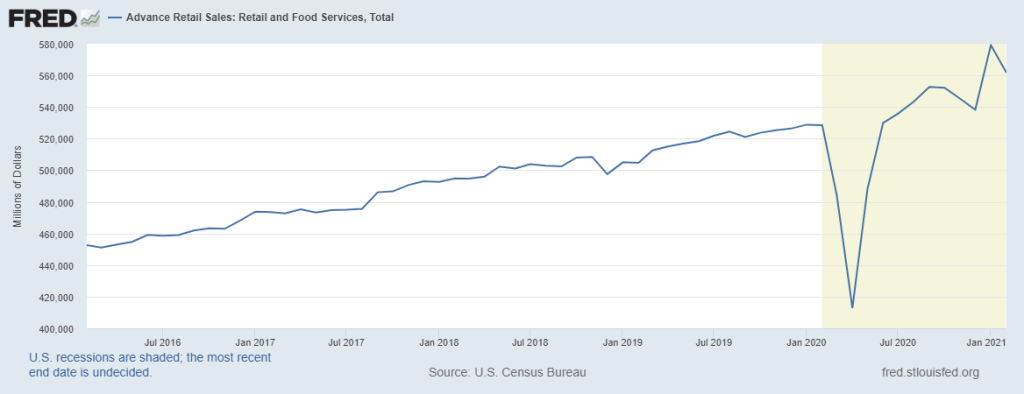 Advance Retail Sales
Total retail sales for February came in at $561.7 billion, a -3.0% decline for the month. Although January’s number was revised higher, from +5.3% to a +7.6% monthly gain. Total retail sales are +6.27% higher than they were last year, and +4.34% year to date.
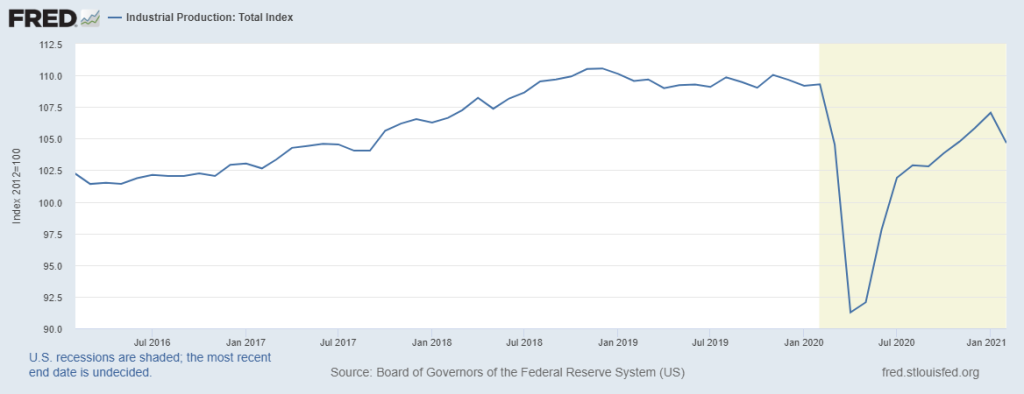 Industrial Production – Total Index
Industrial production declined -2.2% in February, attributed mainly to the severe weather that impacted the south central region, and the global semiconductor shortage. Industrial production has increased 15% off the April 2020 lows, but has only recovered about 74% of the COVID decline (down -4.3% from this time last year).
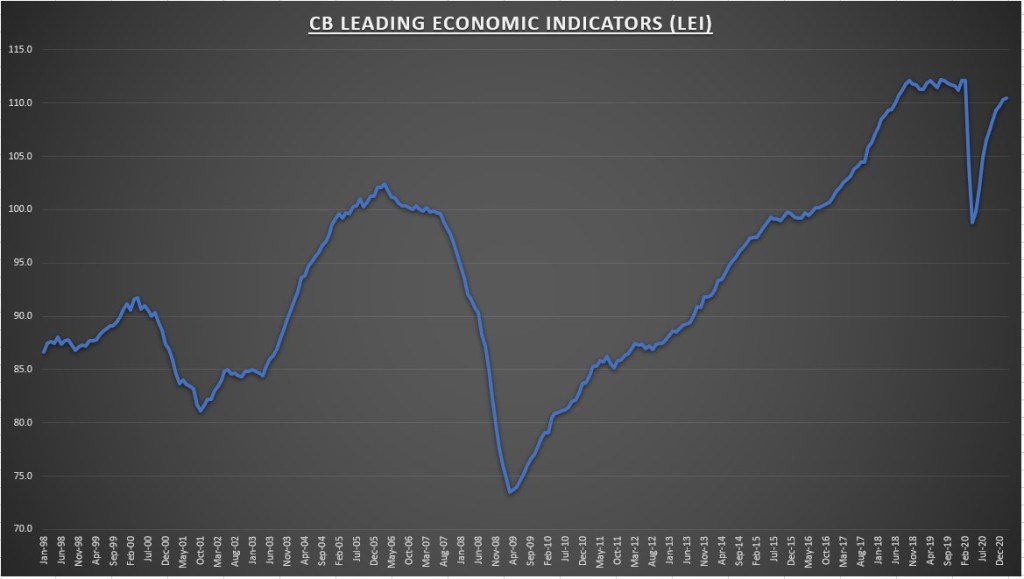 CB Leading Economic Indicators
The Conference Board’s Composite Index of Leading Economic Indicators (LEI) index increased 0.2% in February, but still down 1.4% on an annual basis. Key points (emphasis mine):
“Indeed, the acceleration of the vaccination campaign and a new round of large fiscal supports are not yet fully reflected in the LEI. With those developments, The Conference Board now expects the pace of growth to improve even further this year, with the U.S. economy expanding by 5.5 percent in 2021.”
“Despite widespread improvements among the leading indicators, some measures—including weekly hours in manufacturing, permits for residential housing, and consumers’ outlook for business and economic conditions—showed signs of weakness.
"Bad weather and assorted supply-chain disruptions may have impacted these particular leading indicators in February, and the effects may prove transitory.”
Notable earnings
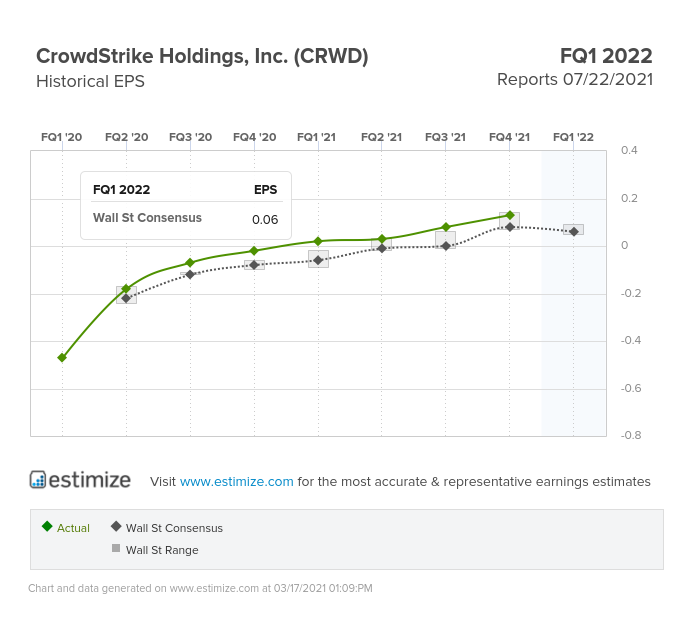 Crowdstrike Holdings Historical EPS Chart
Cybersecurity firm CrowdStrike Holdings (NASDAQ:CRWD) reported adjusted EPS and revenues above street expectations.
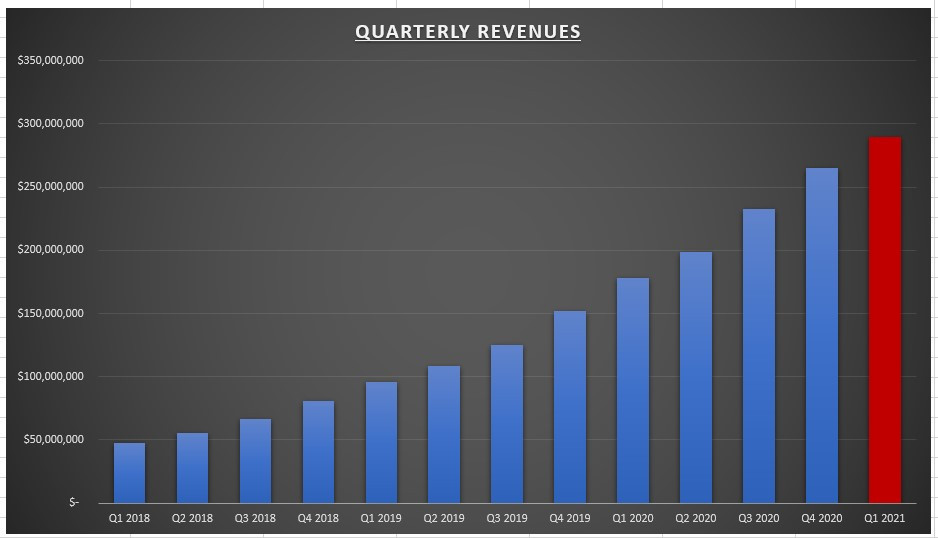 CrowdStrike Quarterly Revenue Chart
Total revenues grew 74% for the quarter on a year over year basis, and 14% growth sequentially. Revenues grew 82% for the entire fiscal year. The company guided for 63% revenue growth in Q1 and 50% revenue growth for the fiscal year.
Margin improvements continued, as gross margins came in at 74.8%, and operating margins came in at -6.0%. These are the best numbers the company has ever reported. I expect the company to turn GAAP profitable during the fiscal year.
Some additional highlights:
- 82% growth in new customer subscriptions
- Subscription customers who have adopted four or more modules increased to 63%
- Surpassed the $1 billion mark for annual recurring revenue (ARR)
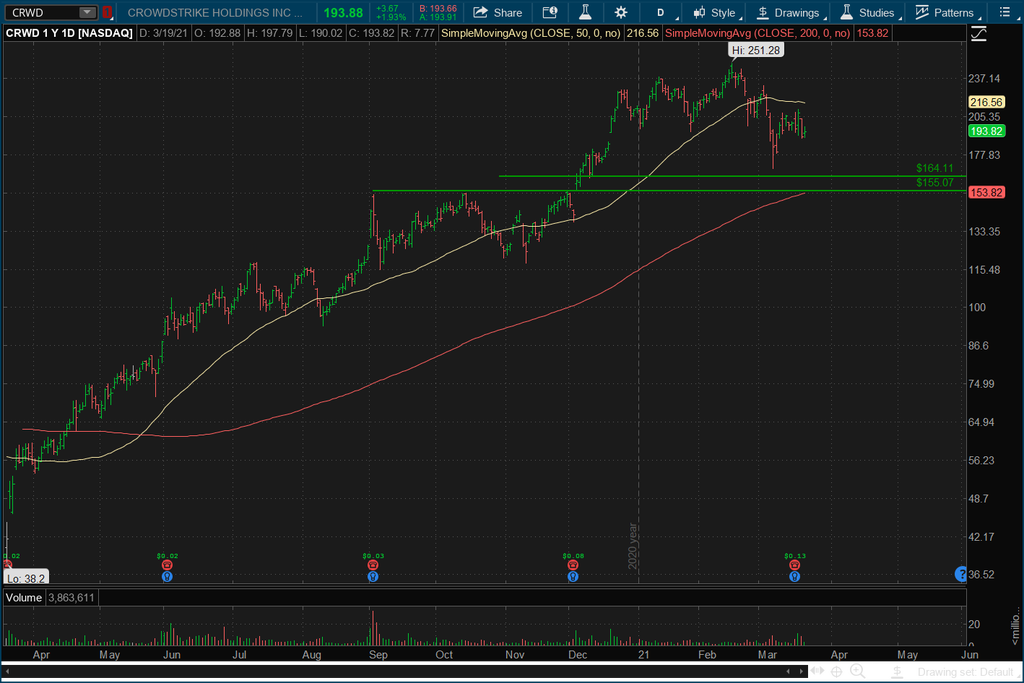 CrowdStrike Daily Price Chart
The stock gained 325% last year—clearly we can’t expect that to continue forever. I’ll be looking to add if the stock drops into the $155-$165 range. I like the company’s long-term potential.
Strong growth, strong balance sheet, in an important industry. A lot of competition within the cybersecurity space though. We’ll see how it plays out. I’m long Crowdstrike, Zscaler (NASDAQ:ZS), and Fortinet (NASDAQ:FTNT).
Chart of the week
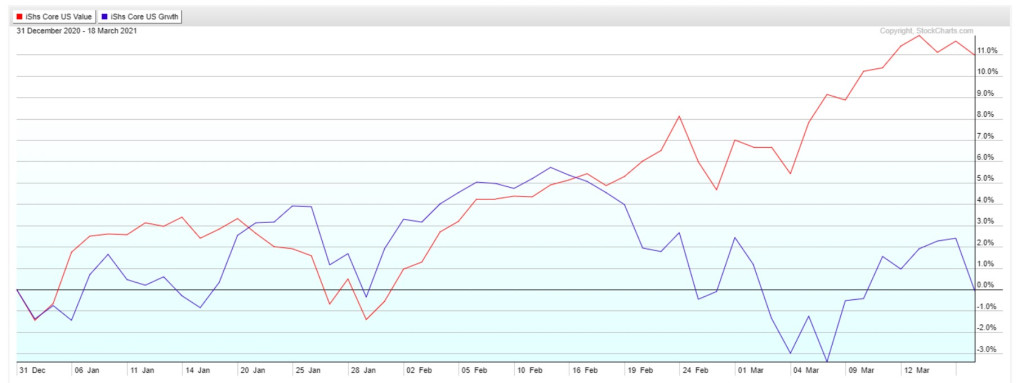 Chart Of The Week
What a difference a year makes. Large cap growth stocks gained 32.7% last year, while large cap value stocks only gained 1.6%. This year is going in the opposite direction. Large cap growth is down 0.1% so far this year, while large cap value stocks are up 11%.
This could certainly change by year's end, but it proves the point that the worst investment strategy in the world is to pile into everything that has gone up the most. Stay diversified and stay disciplined!
Summary
The Federal Reserve increased its forecast for economic growth this year (+6.5% real GDP, the highest since 1984) while maintaining its pledge of accommodative monetary policy for as long as possible.
I have a feeling inflation will test the Fed’s patience later this year, but the question will be if it's temporary or a trend. The Fed believes it to be transitory, but as I pointed out before, the Fed also believed the yield curve inversion of 2018 wasn’t a big deal… until it was.
For now its all about earnings growth (currently estimated to grow 25% this year), an economy that is poised for record growth, and interest rates that are still low enough to provide little competition to stocks. Yes, rates have tripled in the last six months.
But they are going up for the right reasons. And the latest CPI report shows 1.7% annual increase, which I expect to increase in the months to come. So rates are basically 0% net of inflation. As I’ve said before, we shouldn’t have negative real rates in this environment.
With a 4.5% earnings yield and 1.5% dividend yield, I don’t see rates causing a problem for the market as a whole (sure certain areas of the market will suffer, particularly the ones with the highest valuations) even if the 10-year Treasury rate rose to 3% (my guess is rates will rise to the 2% – 2.5% range), as long as the Fed is able to remain accommodative. Time will tell.
This week there are five S&P 500 companies reporting earnings. I’ll be paying close attention to Adobe (NASDAQ:ADBE) on Tuesday. For economic data we’ll have New Home sales on Tuesday, the final reading on Q4 GDP on Thursday, and core PCE (the Fed’s preferred measure of inflation) on Friday.
Along with plenty of Fed speak throughout the week. Another busy one!
Leave a comment