It’s been a tough eighteen months for airlines as they continue to wait out the end of the pandemic travel restrictions, all the while drowning in a rising tide of debt. One such is Southwest Airlines Company (NYSE:) which has the charming LUV ticker but whose daily chart has an ominous look.
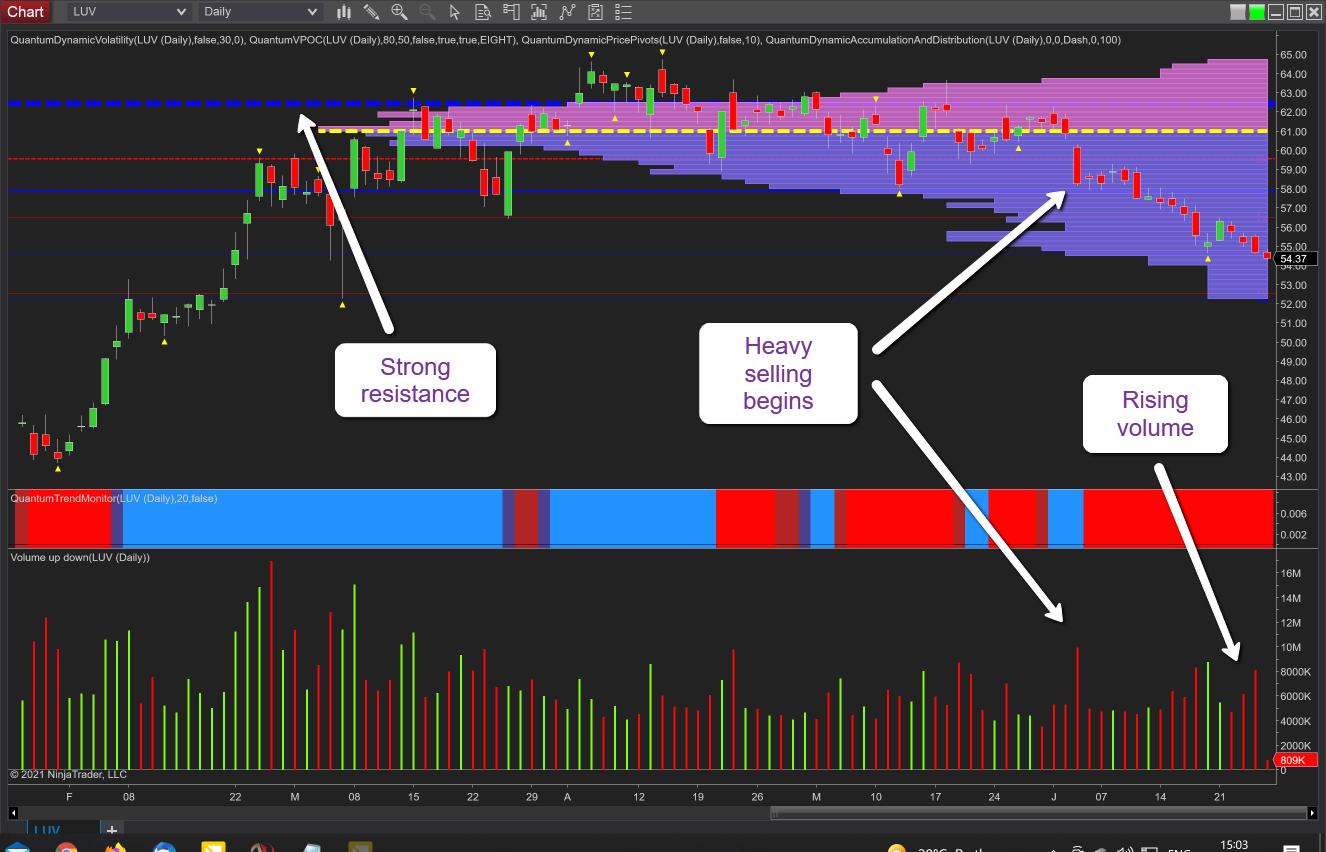
The rally of the early part of the year ran into a headwind as the price action reached the dizzy heights of $64.75 per share before moving into a sustained period of congestion at the VPOC (volume point of control) firmly anchored in the $61 per share price point. The weak technical picture was further reinforced with several failed attempts to rally and as a result, created a strong level of resistance at $62.40 per share and denoted with the blue dashed line of the accumulation and distribution indicator. The indicator thickens each time a level is tested and holds and so displays an instant and visual picture of all key levels and their relative strength and weakness.
The significant move away from this region occurred on the 3rd June with the wide spread down candle on high volume validating the selling pressure building at the time and since reinforced in the price waterfall which duly followed. Note also over the last three days where we have falling prices on rising volume thereby confirming the weakness for the stock, and with the VPOC histogram falling away a move to $52 per share and beyond now seems likely, particularly as the stock closed out Thursday’s session at $54.66 and dipped even lower on Friday.
Perhaps a potential short for this stock either directly or via puts. The next earnings report is due on 22nd July with a forecast EPS of -$0.37 so plenty of time to take advantage of any short side.
Fusion Media or anyone involved with Fusion Media will not accept any liability for loss or damage as a result of reliance on the information including data, quotes, charts and buy/sell signals contained within this website. Please be fully informed regarding the risks and costs associated with trading the financial markets, it is one of the riskiest investment forms possible.

