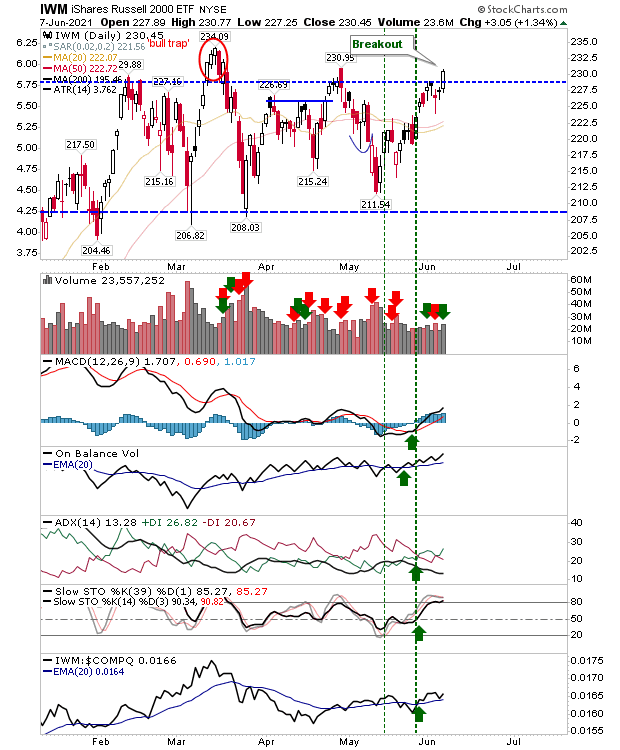
There wasn’t a whole lot to today’s trading, but the did manage to break out of its trading range on higher volume accumulation. Technicals are net positive, including relative performance.

IWM Daily Chart
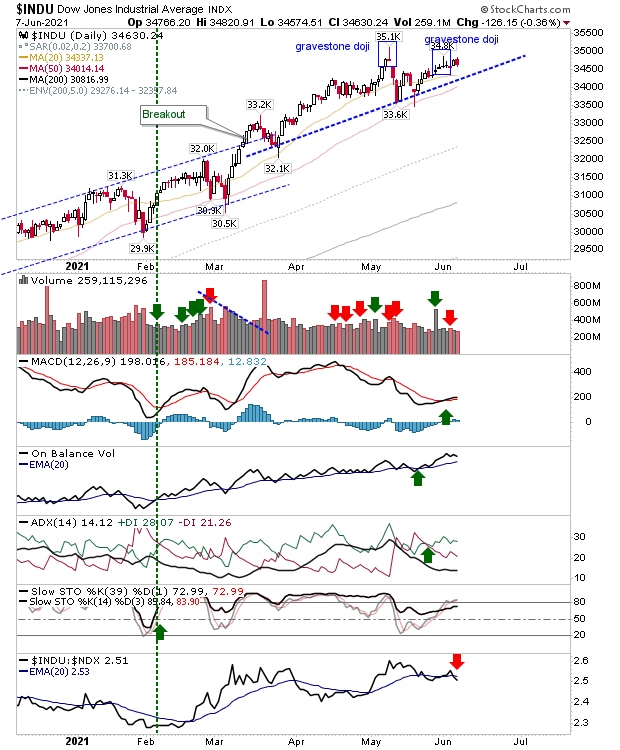
While the finished with a bearish cloud cover, enough to keep the duel gravestone doji in play. The rising trendline is the trigger line between bullish and bearish stance for the index. Meanwhile, the index is underperforming relative to the .

INDU Daily Chart
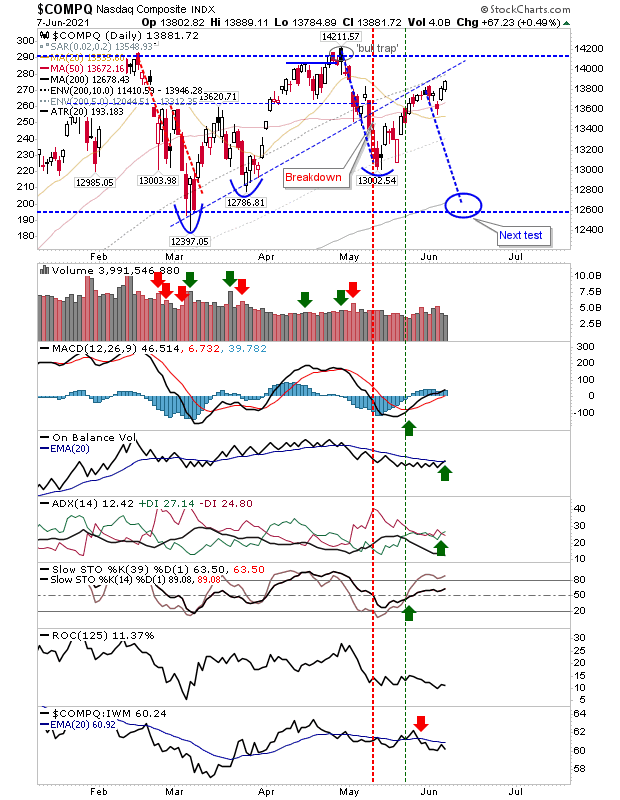
The NASDAQ is edging towards resistance, but it remains below the current trendline connecting March swing lows, and is well inside the trading range. While the index is underperforming relative to the Russell 2000, until there is a break of the trading range, current action is just noise.

COMPQ Daily Chart
The indices are playing a mix of bullish and bearish signals, but really, it’s up to the Russell 2000 to do the leading.
Fusion Media or anyone involved with Fusion Media will not accept any liability for loss or damage as a result of reliance on the information including data, quotes, charts and buy/sell signals contained within this website. Please be fully informed regarding the risks and costs associated with trading the financial markets, it is one of the riskiest investment forms possible.

