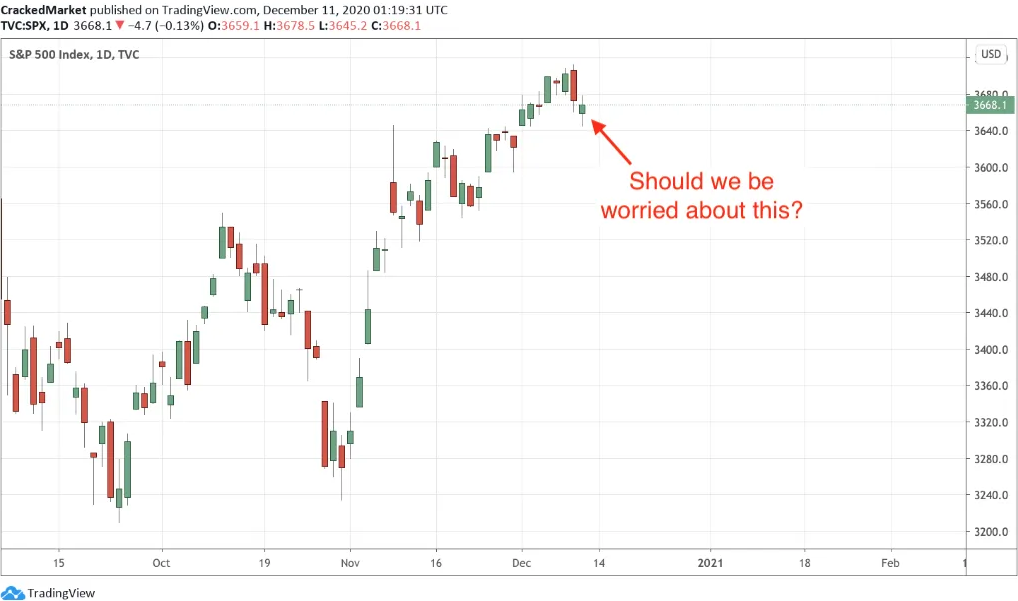
The S&P 500 slipped for the second day in a row. But rather than devolve into a mad dash for the exit, like we would expect from a fragile and grossly overbought market, supply dried up within minutes and prices bounced back near breakeven. So much for this selloff, we barely got to know ya.
 S&P 500 Index Daily Chart
Of course, this stubborn resilience shouldn’t surprise anyone. This is how every down-day since the November lows ended. (And almost every down-day since the March lows.)
While it sounds sophisticated to argue against a strong trend, because only sheep jump aboard something this easy and obvious, the truth is, a trend is far more likely to continue than reverse.
There have been 190ish trading sessions since the March lows. And in those 190 days, exactly zero have been the start of the next big pullback. But hey, maybe the 191st time is the charm and bears will finally get what they’ve been calling for. But…probably not.
I’m not suggesting we hold blindly. Every savvy trader has been following this rebound with a trailing stop. But until something changes, we keep giving this bull market the benefit of doubt. Maybe the index slips back to 3,600 support. Or maybe even 3,500. But until further notice, we treat every dip as a buying opportunity.
Leave a comment