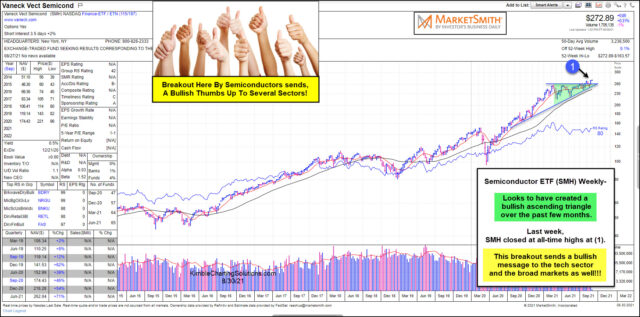
Long-Term Weekly SMH Chart.
The semiconductors sector has always been a great read for the pulse of the technology economy (and the ) reflected from this chart from Marketsmith.com
Tech investors often look to the semiconductors for leadership. When semiconductors are leading (or breaking out), it’s a good thing. And because technology is a major part of our economy, all investors should be paying attention to semiconductors.
Today’s chart is a long-term “weekly” chart of the popular VanEck Vectors Semiconductor ETF (NASDAQ:).
As you can see, SMH appears to have created a bullish ascending triangle over the past few months. And, last week, this ETF closed at all-time highs (1).
This breakout sends a bullish message to the tech sector, and the broad markets as well. Now, we just need to see follow-through buying and it will be two bullish thumbs up for investors. Stay tuned.
Fusion Media or anyone involved with Fusion Media will not accept any liability for loss or damage as a result of reliance on the information including data, quotes, charts and buy/sell signals contained within this website. Please be fully informed regarding the risks and costs associated with trading the financial markets, it is one of the riskiest investment forms possible.

