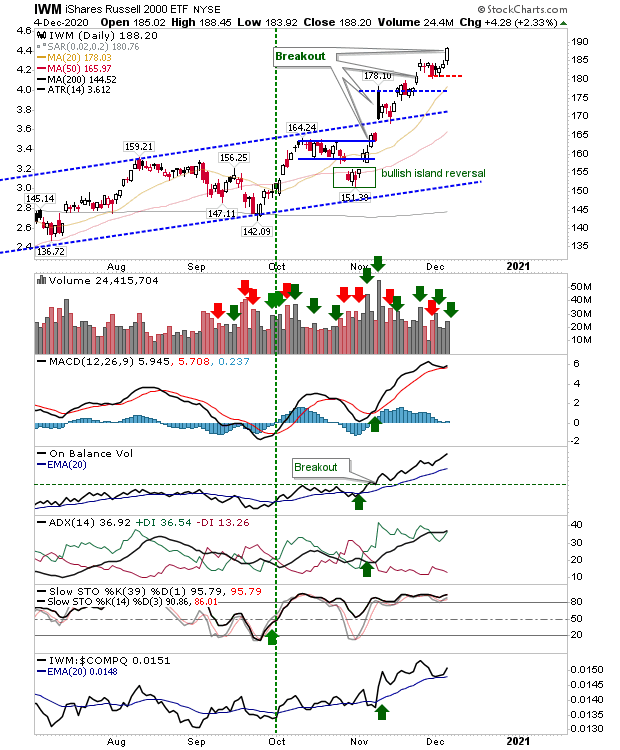
Friday belonged to the Russell 2000 (via IWM) as it cleared resistance on higher volume accumulation. It was the index to do most of the work, and is also the index which is the most extended from its 200-day MA.
 IWM Daily Chart
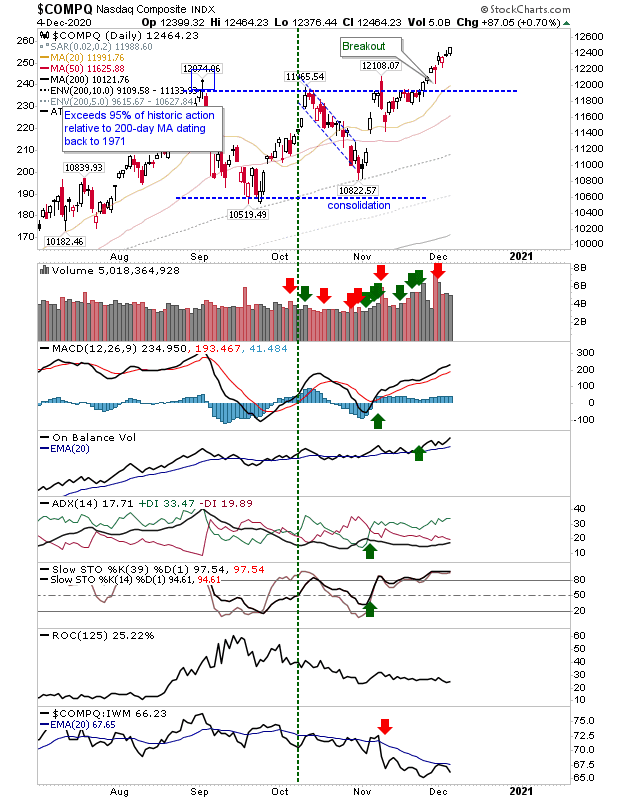
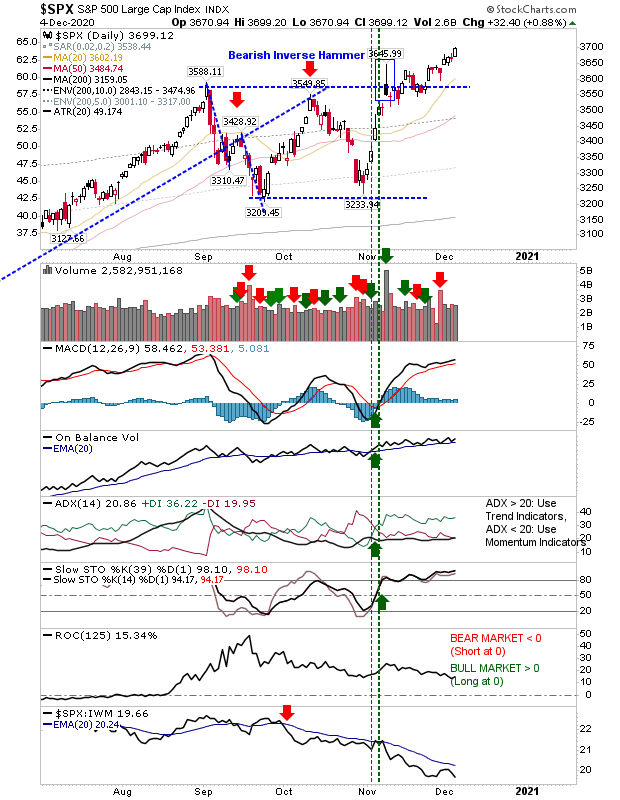
For the NASDAQ and S&P it was a question of maintaining the rally and putting more distance to nearest breakout support so that when sellers do return, they have enough room to absorb a loss (e.g. 10%) without a break in this support. The good news for the S&P is that last week's action was enough to negate the bearish implications from the inverse hammer. Not surprisingly, supporting technicals for both indices remain positive with little in the way of potential divergences to worry about.
 COMPQ Daily Chart
  SPX Daily Chart
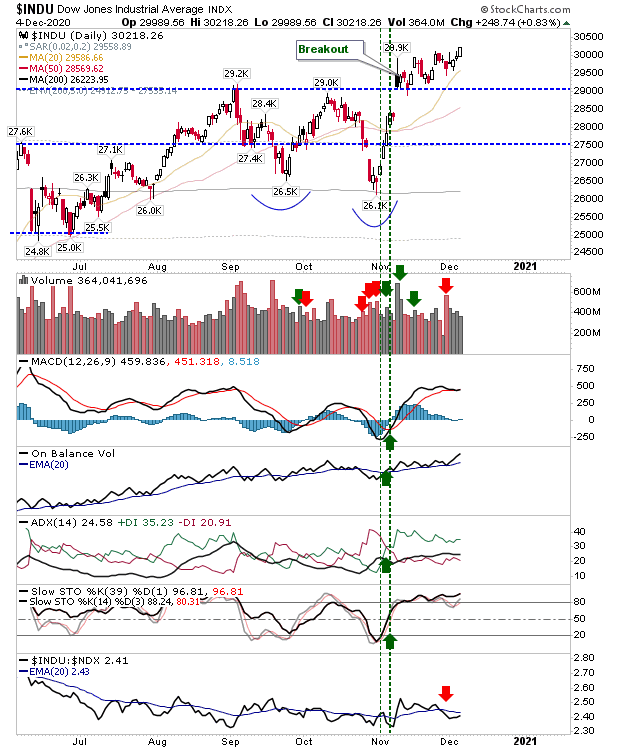
Even the Dow Jones Industrial Average got in on the action. Although it hasn't been as gung-ho as the other indices it does have a breakout to defend where Friday's action was also the day when its bearish inverse hammer was negated.
 INDU Daily Chart
It looks like the Santa rallies are well and truly here, so it's just a question of maintaining this momentum into the end-of-year. 2021 will be a different kettle of fish, but if there is enough room to protect the breakouts from a bout of profit taking, then there is a chance everyone can be a winner.
Leave a comment