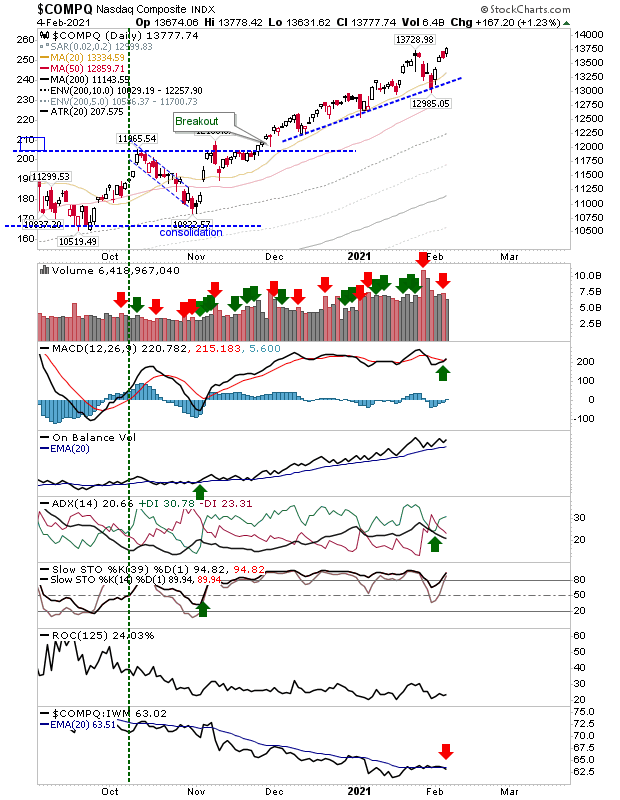
The NASDAQ and Russell 2000 both enjoyed pushes to new all-time highs, albeit on relatively light volume. Despite the gain, the NASDAQ lost relative ground against the Russell 2000 but the gain keeps the November trend running. Technicals returned to net bullish.
 COMPQ Daily Chart
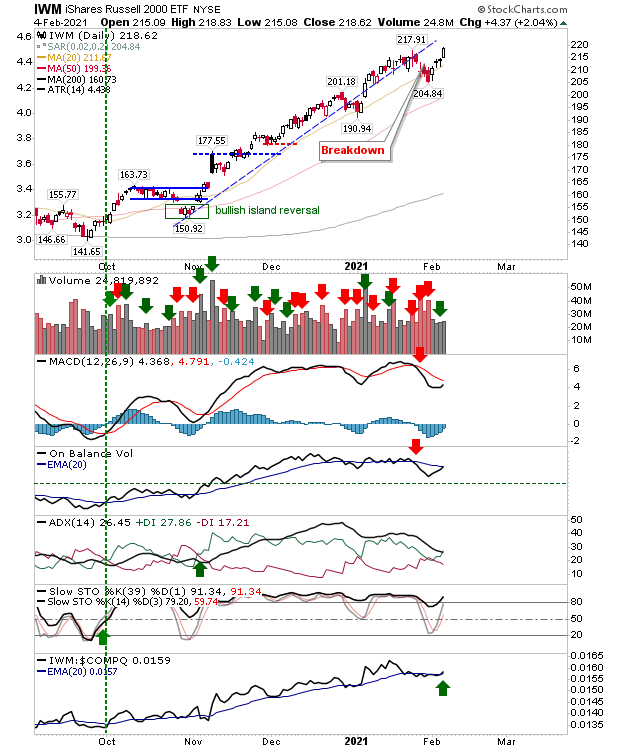
The Russell 2000 marked a new high as it returned to its November rally like the NASDAQ. The 20-day MA has offered itself as support for a second time this year; it looks like this rally is been guided by this moving average—if the moving average breaks, then things shift into a new phase.
 IWM Daily Chart
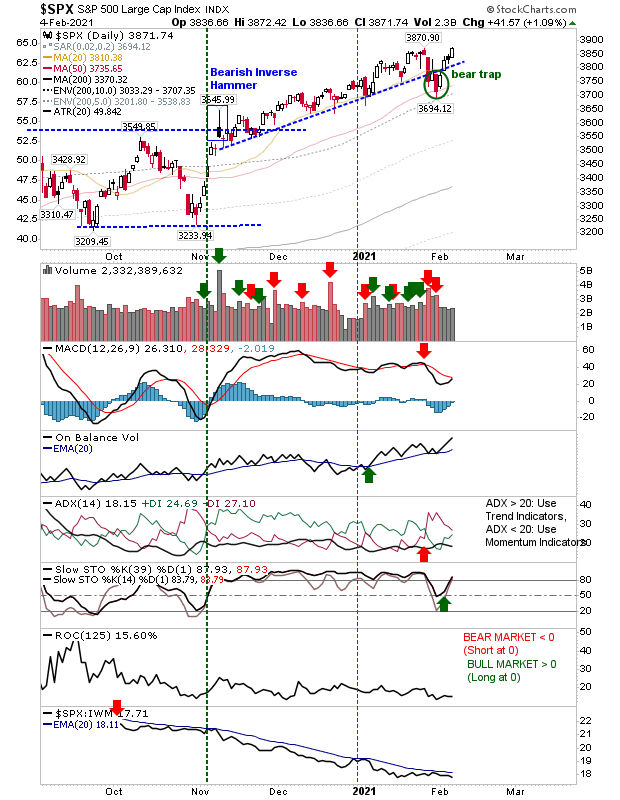
The S&P 500 just about edged a new high as it confirmed a 'bear trap' on what for it, was a successful test of its 50-day MA.The index has been underperforming the Russell 2000 since October but the rate of loss has slowed since the start of the year and it may be about to return into the ascendancy.
 SPX Daily Chart
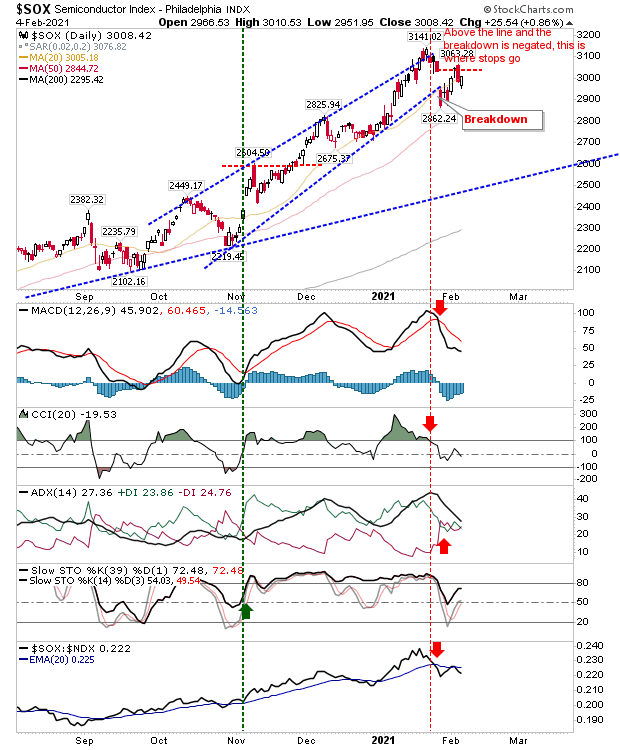
The most bearish index was the Semiconductor Index. It closed the breakdown gap, but pushed off gap resistance after the gap closed. Technicals are mostly bearish, but key momentum is still on the bullish side of the fence.
 SOX Daily Chart
Now that indices have returned to highs, next step is to see if they can keep on rolling higher.
Leave a comment