Canadian banks are known to be much more conservative than their U.S. peers. For instance, due to better lending practices, the country barely felt the 2007-2009 housing crisis. That did not prevent its stock market from collapsing in sympathy, though. The share price of the Royal Bank of Canada (TSX:) (NYSE:) for example – the biggest financial institution in the country – fell over 58% during the crisis.
Apparently, when things get complicated the “sell first ask questions later” principle applies to Canada, as well. Right now, on the other hand, it feels like investors are more concerned not to miss out on the uptrend. Royal Bank of Canada stock is hovering around C$125, up 74% from the March 2020 low.
Should we buy Royal Bank of Canada stock at records highs or would we be better off just watching from a safe distance? That is the question we hope Elliott Wave analysis will help us find the answer to.
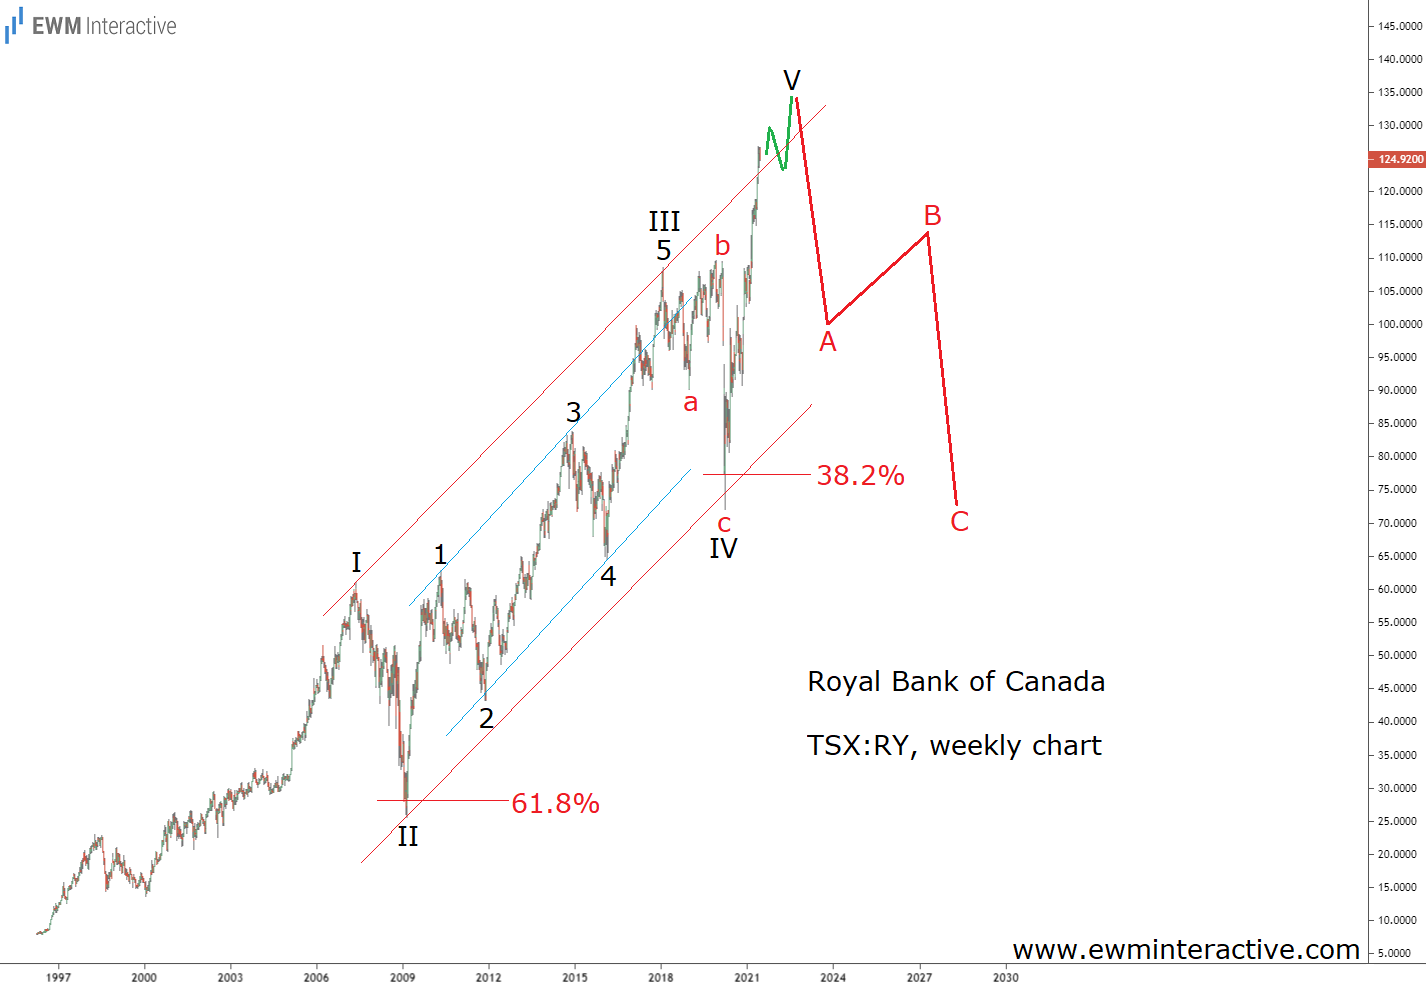
The weekly chart above reveals the stock’s path over the past 25 years. Turns out that over that quarter of a century Royal Bank of Canada has drawn a textbook five-wave impulse. The pattern is labeled I-II-III-IV-V, where the five sub-waves of wave III are also visible.
Royal Bank of Canada Stock Can Tumble 40 to 50 Percent
Wave II is the 2007-2009 crash we mentioned earlier, which ended shortly after touching the 61.8% Fibonacci level. Wave IV, which was an expanding flat correction, also took the Golden Ratio into account. The pandemic selloff formed a bottom slightly below the 38.2% retracement level.
If this count is correct, the current surge to a new all-time high must be part of wave V. The fifth wave concludes the larger impulse and is often fully erased by the following three-wave correction. In the case of Royal Bank of Canada, this translates into a decline back to the C$75 – C$70 support area.
The stock price just breached the line drawn through wave I and III. Some might see this as a bullish sign, but note that wave 5 of III also breached the 1-3 line just before the bears showed up in wave IV. In our opinion, this not the time to join the bulls. The stock looks poised for a 40% – 50% drop once wave V is over.
Fusion Media or anyone involved with Fusion Media will not accept any liability for loss or damage as a result of reliance on the information including data, quotes, charts and buy/sell signals contained within this website. Please be fully informed regarding the risks and costs associated with trading the financial markets, it is one of the riskiest investment forms possible.


