US Real Estate Investment Trusts (REITs) rebounded in last week’s trading (through Mar. 12), posting the best performance by far for the major asset classes, which delivered mixed results overall, based on a set of proxy ETFs.
After slipping for three straight weeks, Vanguard US Real Estate Index Fund ETF Shares (NYSE:VNQ) rebounded sharply, rising 5.5% for the trading week. Although the fund has yet to regain its pre-pandemic high, VNQ rallied to its highest close since markets began rebounding in late-March 2020.
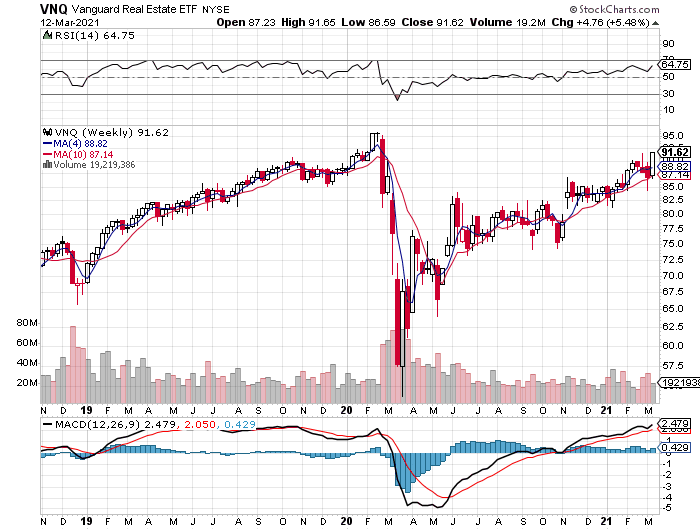 VNQ Weekly Chart
Most slices of the major asset classes rose last week, including US and foreign stocks, commodities and foreign property shares. The big loser: investment-grade bonds in the US.
Vanguard Total Bond Market Index Fund ETF Shares (NASDAQ:BND) continued to tumble, shedding 0.5% last week. The decline marks the ETF’s sixth straight weekly loss.
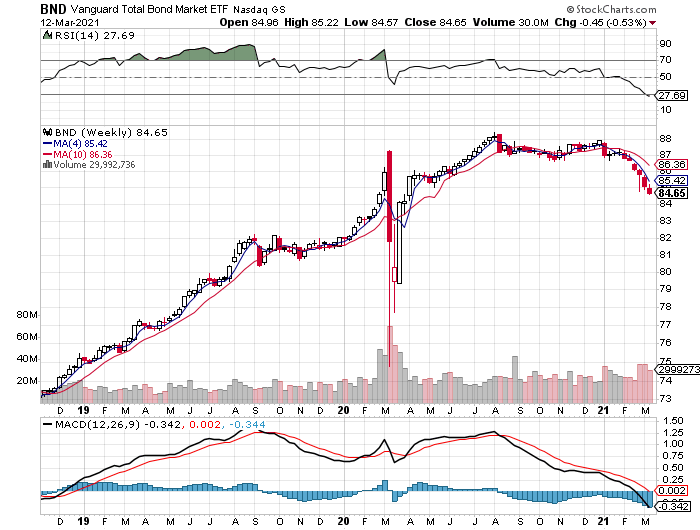 BND Weekly Chart
Driving bonds lower—rising interest rates, which move inversely with prices for fixed-income securities. The latest slide in bond prices comes ahead of this week’s Federal Reserve meeting, policy announcement and press conference on Wednesday, Mar. 17. The news that day will be closely read as investors try to gauge the outlook for inflation, interest rates and monetary policy.
According to Steven Ricchiuto, chief U.S. economist for Mizuho:
“The Fed is aiming for higher inflation, which means higher interest rates.”
The Fed is widely expected to leave its target rate unchanged at the current 0%-to-0.25% target range. Fed funds futures, for instance, are pricing in a 100% probability of no change in rates on Wednesday. Nonetheless, analysts are debating if a sooner-than-expected rate hike is brewing down the road.
“The risk obviously is that a rate hike appears in the 2023 forecast on the back of the recently passed fiscal package,”
writes economist Tim Duy in research note for clients via SGH Macro Advisors.
“I think the Fed will resist that outcome.”
Meanwhile, the Global Markets Index (GMI.F) continued to rise last week, posting a solid 2.1% gain. This unmanaged benchmark holds all the major asset classes (except cash) in market-value weights via ETF proxies.
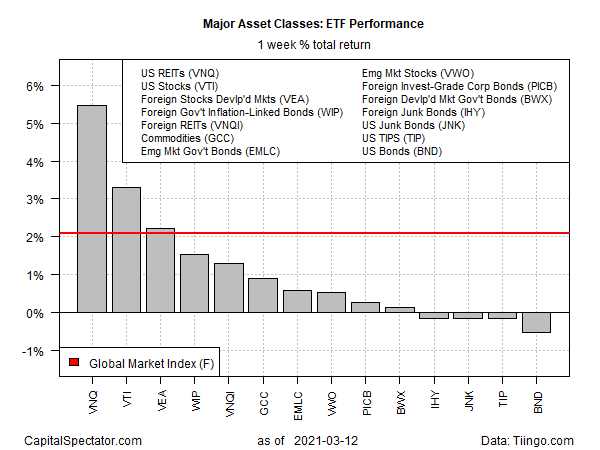 GMI-ETF Weekly Returns Barplot
Turning to the trailing one-year return, US equities are still the leading performer for the major asset classes. Vanguard Total Stock Market Index Fund ETF Shares (NYSE:VTI) is up an extraordinary 69.4% over the past 12 months on a total return basis.
Note that one-year returns for global markets generally are unusually high at the moment because year-ago prices were dramatically depressed due to the coronavirus crash. Accordingly, trailing one-year results will remain temporarily elevated due to extreme year-over-year comparisons until last year’s markets collapse washes out of the annual comparisons.
At the moment, there are no losses for the major asset classes on a one-year basis. The weakest gain is currently posted by foreign government bonds in developed markets. SPDR Bloomberg Barclays International Treasury Bond ETF (NYSE:BWX) closed up 4.5% on Friday vs. its year-earlier price on a total return basis.
GMI.F is up 46.1% over the past year.
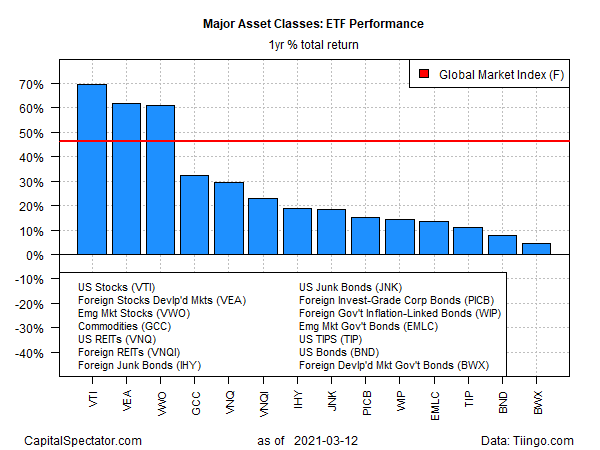 GMI ETF Yearly Returns Barplot
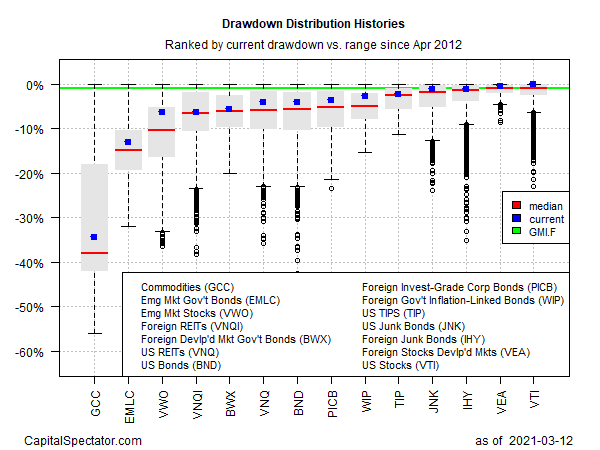
US stocks currently enjoy the smallest drawdown for the major asset classes. VTI closed on Friday with a fractional peak-to-trough decline.
By contrast, broadly defined commodities continue to post the deepest drawdown for the major asset classes: -34.4%.
GMI.F’s current drawdown is a relatively mild 0.9%.
 GMI.F’s Current DrawdownOriginal Article
