
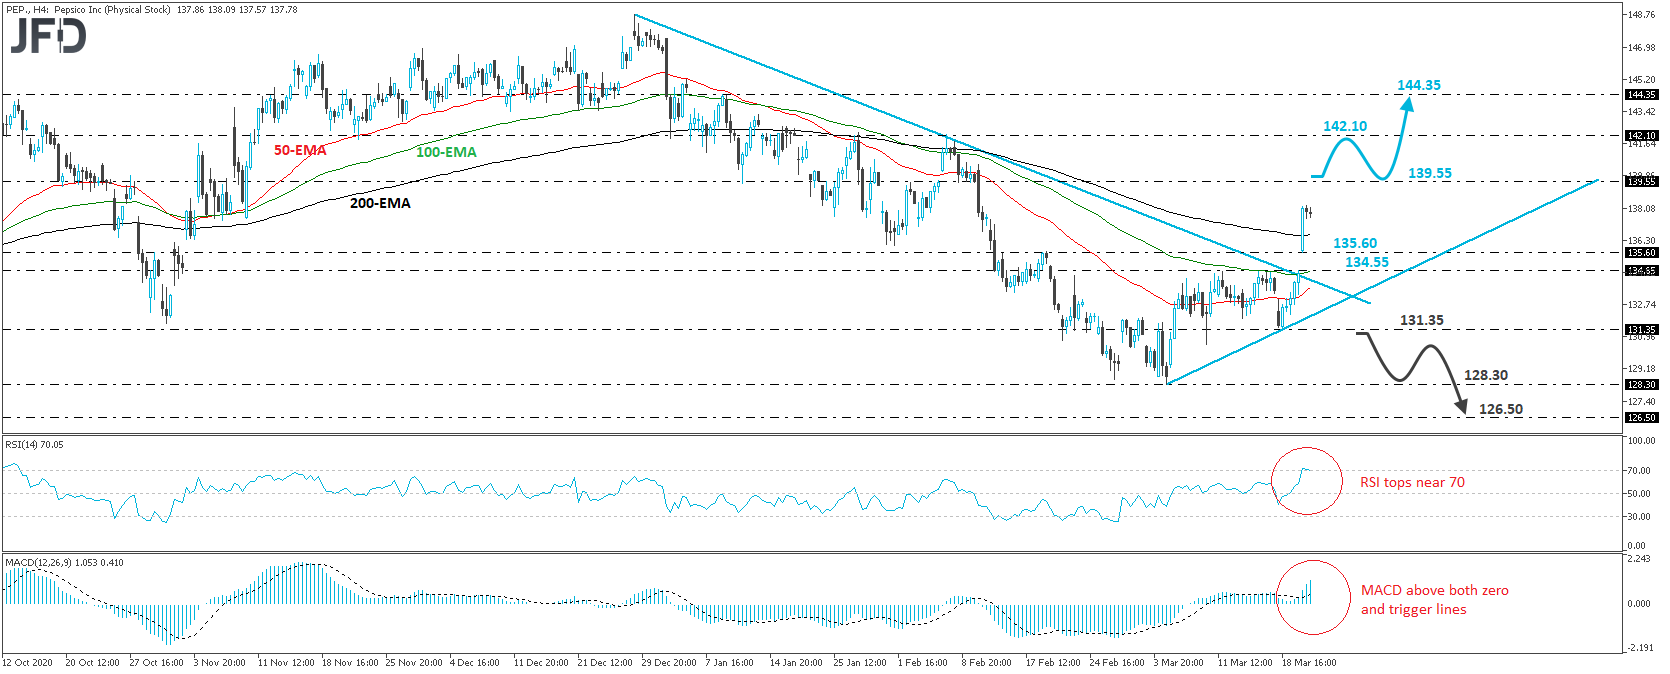
PepsiCo (NASDAQ:PEP) opened with a positive gap on Monday, above the downside resistance line taken from the peak of Dec. 29. The stock continued to trade north throughout the session, but fell short of reaching the 139.55 resistance barrier marked by the inside swing lows of Feb. 8 and 9. In any case, as long as the stock is trading above the aforementioned downside line, we will consider the short-term outlook to have turned back to positive.
We believe that market participants will soon drive the action towards the 139.55 barrier, the break of which is likely to pave the way towards the peak of Feb. 5, at 142.10. If that hurdle is not able to halt the advance either, then we may see extensions towards the 144.35 area, defined as a resistance by the peak of Jan. 11.
Shifting attention to our short-term oscillators, we see that the RSI topped fractionally above its 70 line, while the MACD remains above both its zero and trigger lines, still pointing up. Both indicators detect upside speed, but the fact that the RSI shows signs of topping makes us cautious that a small setback may be in the works before the next positive leg.
In order to abandon the bullish case, we would like to see a decisive dip below 131.35, a support marked by the low of Mar. 18. This will also take the stock below the upside support line drawn from the low of Mar. 4, and may initially aim for that low, at around 128.30. Another break, below 128.30, could extend the fall towards the 126.50 territory, marked by the low of June 15.
 Pepsi stock 4-hour chart technical analysisOriginal Article