
The Nvidia stock (NASDAQ:NVDA) traded in a consolidative manner yesterday, staying close to the lower bound of the sideways range that’s been containing the price action since November 11th, between the 513 support and the 550 resistance. As long as the share price stays between those two boundaries, we will hold a neutral approach.
In order to start examining the case of decent declines, we would like to see a clear close below 513. This will confirm a forthcoming lower low on the 4-hour chart and may pave the way towards the low of October 30th, at around 491. Investors may pick up the stock at that price, but if they are not strong enough to push it back above 513, we may see another round of selling, with the share falling below 491. Such a dip may see scope for extensions towards the lows of September 4th and 8th, at 468.
Taking a look at our short-term oscillators, we see that the RSI runs below 50, but has recently turned up, while the MACD, even though below both its zero and trigger lines, shows signs of bottoming as well. Both indicators detect slowing downside speed, which means that the share price may stay range bound for a while more.
On the upside, a break above the range’s upper end, at 550, may be needed for market participants to get confident again in this stock. Such a rebound would confirm a forthcoming higher high and may open the path all the way towards the stocks record peak of 589, hit on September 2nd. At this point, it is worth mentioning that on November 9th, the share price got very close to that peak, but failed to touch it. If we sea a decent break this time around, the next level to consider as a resistance may be the 610 zone, which coincides with the 261.8% Fibonacci extension level of the aforementioned range’s width.
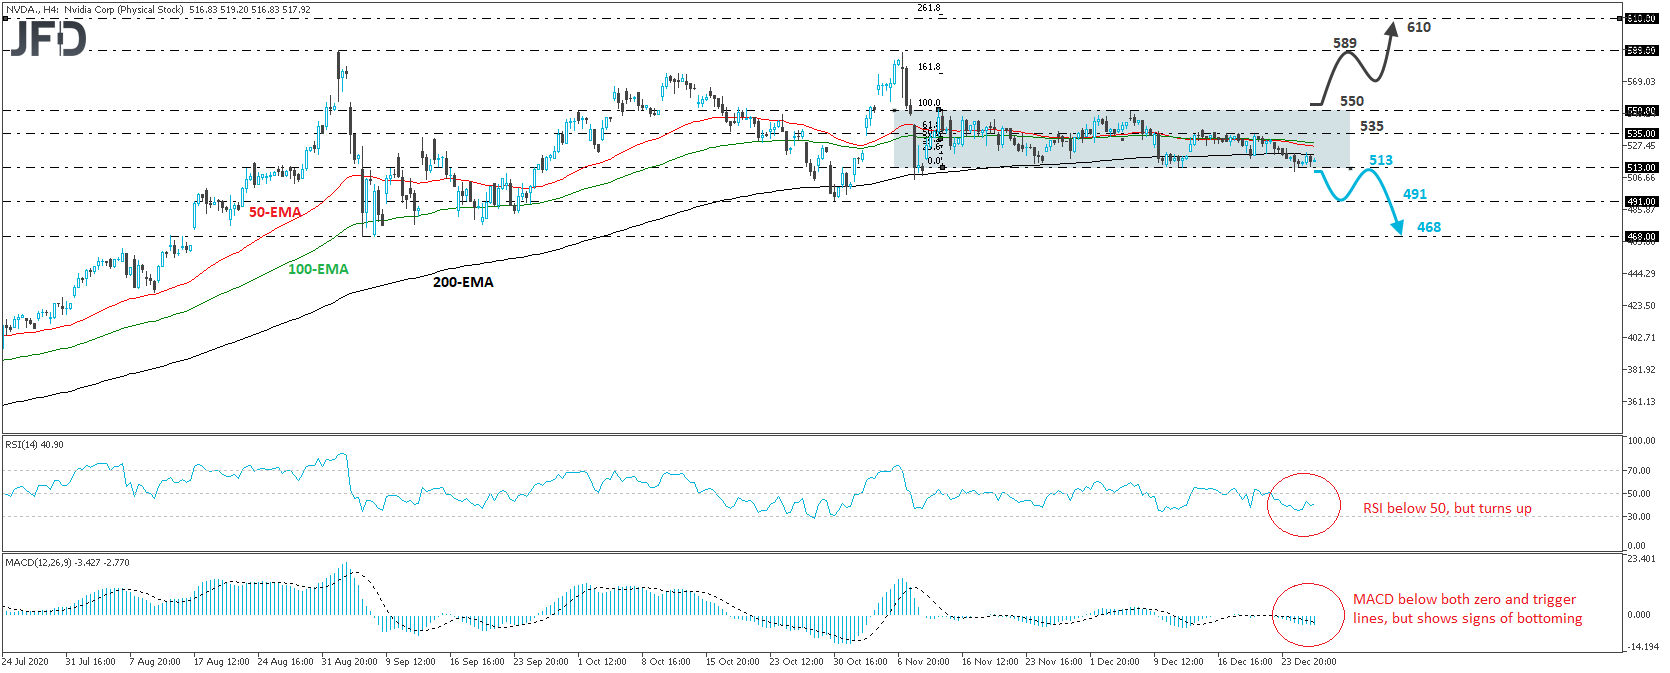 Nvidia stock 4-hour chart technical analysisOriginal Article