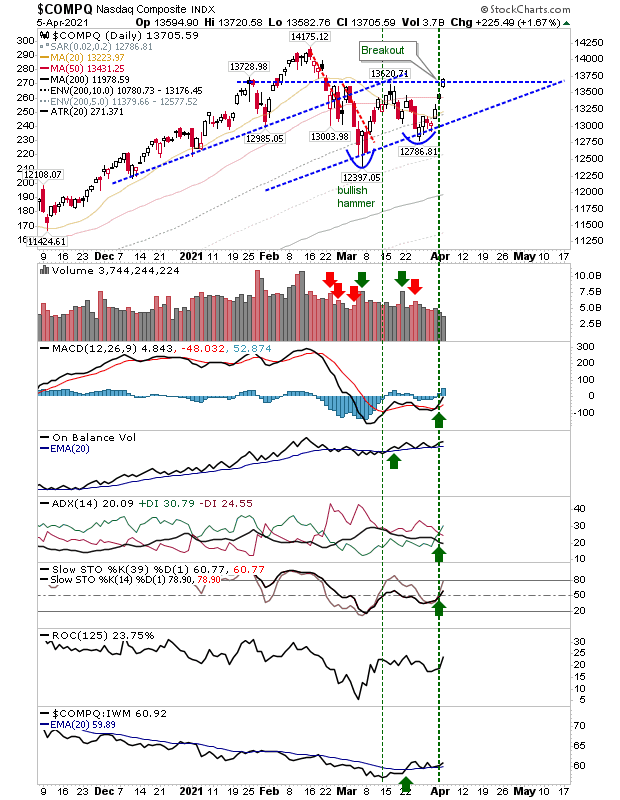
On Monday, gains for indices were enough to drive new swing high breakouts. There wasn’t a whole lot of volume following the Easter holiday, but the intention was clear.
The managed a new closing high which cleared both the late February and March swing highs on the back of a bullish cross in momentum stochastics, and a continued improvement in relative performance to Small Caps.

COMPQ Daily Chart
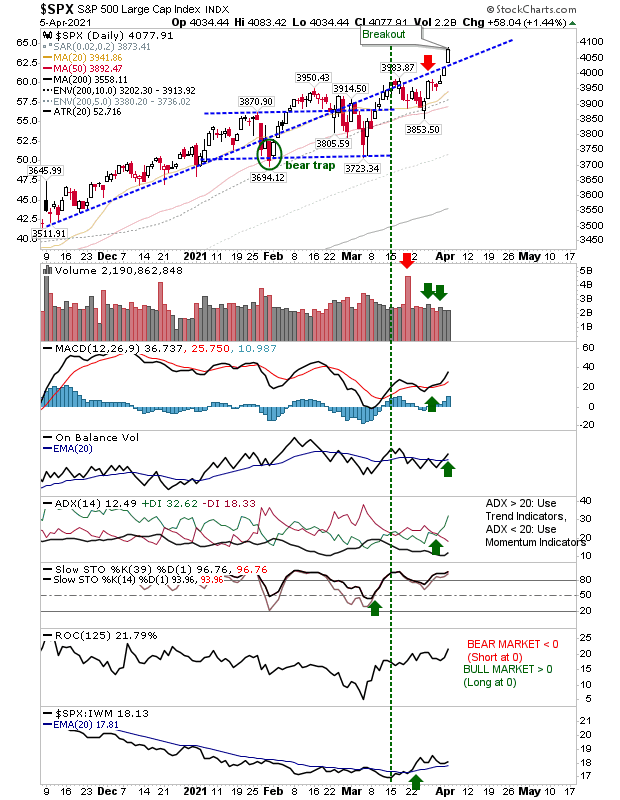
The also cleared trendline resistance in an acceleration of the bullish trend. There was a bullish cross in On-Balance-Volume to support the ADX and MACD. Momentum is overbought, but not in a way to suggest a stop is in place.

SPX Daily Chart
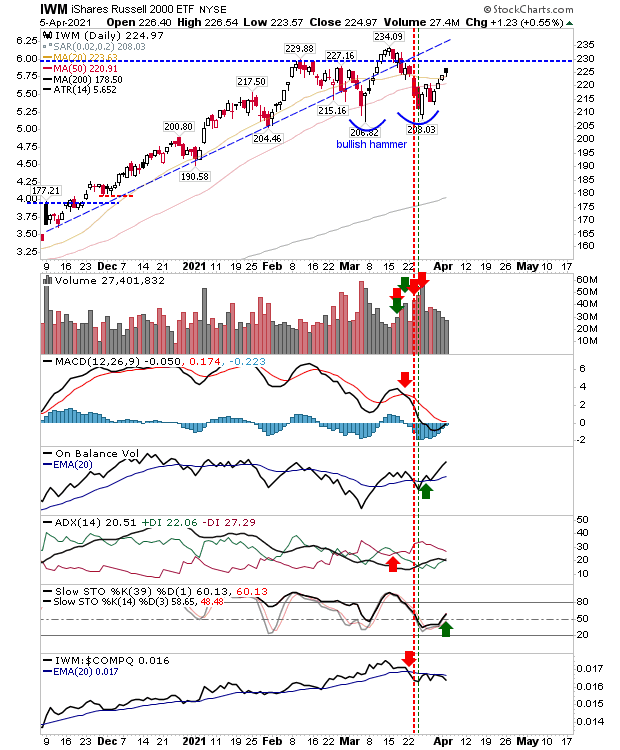
The (via ) was more low key. While it posted a gain it wasn’t able to challenge any major price resistance, although there was a bullish cross in stochastic and an acceleration in On-Balance-Volume.

IWM Daily Chart
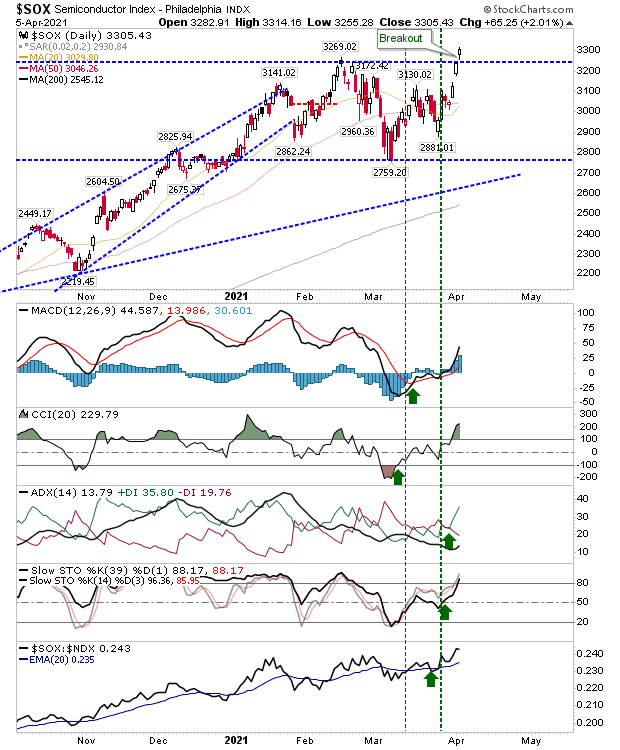
In terms of the movers-and-shakers, we have a which cleared the February swing high with technicals net bullish and relative performance also at a new swing high. This strength should help the NASDAQ and .

SOX Daily Chart
The rotation away from Small Caps continues, with Large Caps (and Tech, to a lesser degree) benefitting. Large Caps have been steadily improving, but Tech has been in consolidation mode for a couple of months now, and this will likely lead to a more bullish outcome in the latter part of this year.
Small Caps still have plenty of mean reversion to do, but they remain well above their 200-day MA; in fact, the index is still above the 95% of historic bullish action relative to its 200-day MA going back to 1987; plenty of profits still to take here…
Fusion Media or anyone involved with Fusion Media will not accept any liability for loss or damage as a result of reliance on the information including data, quotes, charts and buy/sell signals contained within this website. Please be fully informed regarding the risks and costs associated with trading the financial markets, it is one of the riskiest investment forms possible.

