With the US “big tech” earnings season just around the corner, traders will be keying in on the gargantuan FAAMG (Facebook (NASDAQ:), Apple (NASDAQ:), Amazon (NASDAQ:), Microsoft (NASDAQ:), and Google/Alphabet (NASDAQ:)) names that drive so much of the performance in the broader indices.
We’ll have individual breakdowns with the key themes and expectations for these companies in the coming weeks, but it’s worthwhile to start by analyzing the technical picture for the (US Tech 100) index, which has nearly 40% of its holdings in the FAAMG stocks, before delving into the idiosyncrasies of the individual stocks.
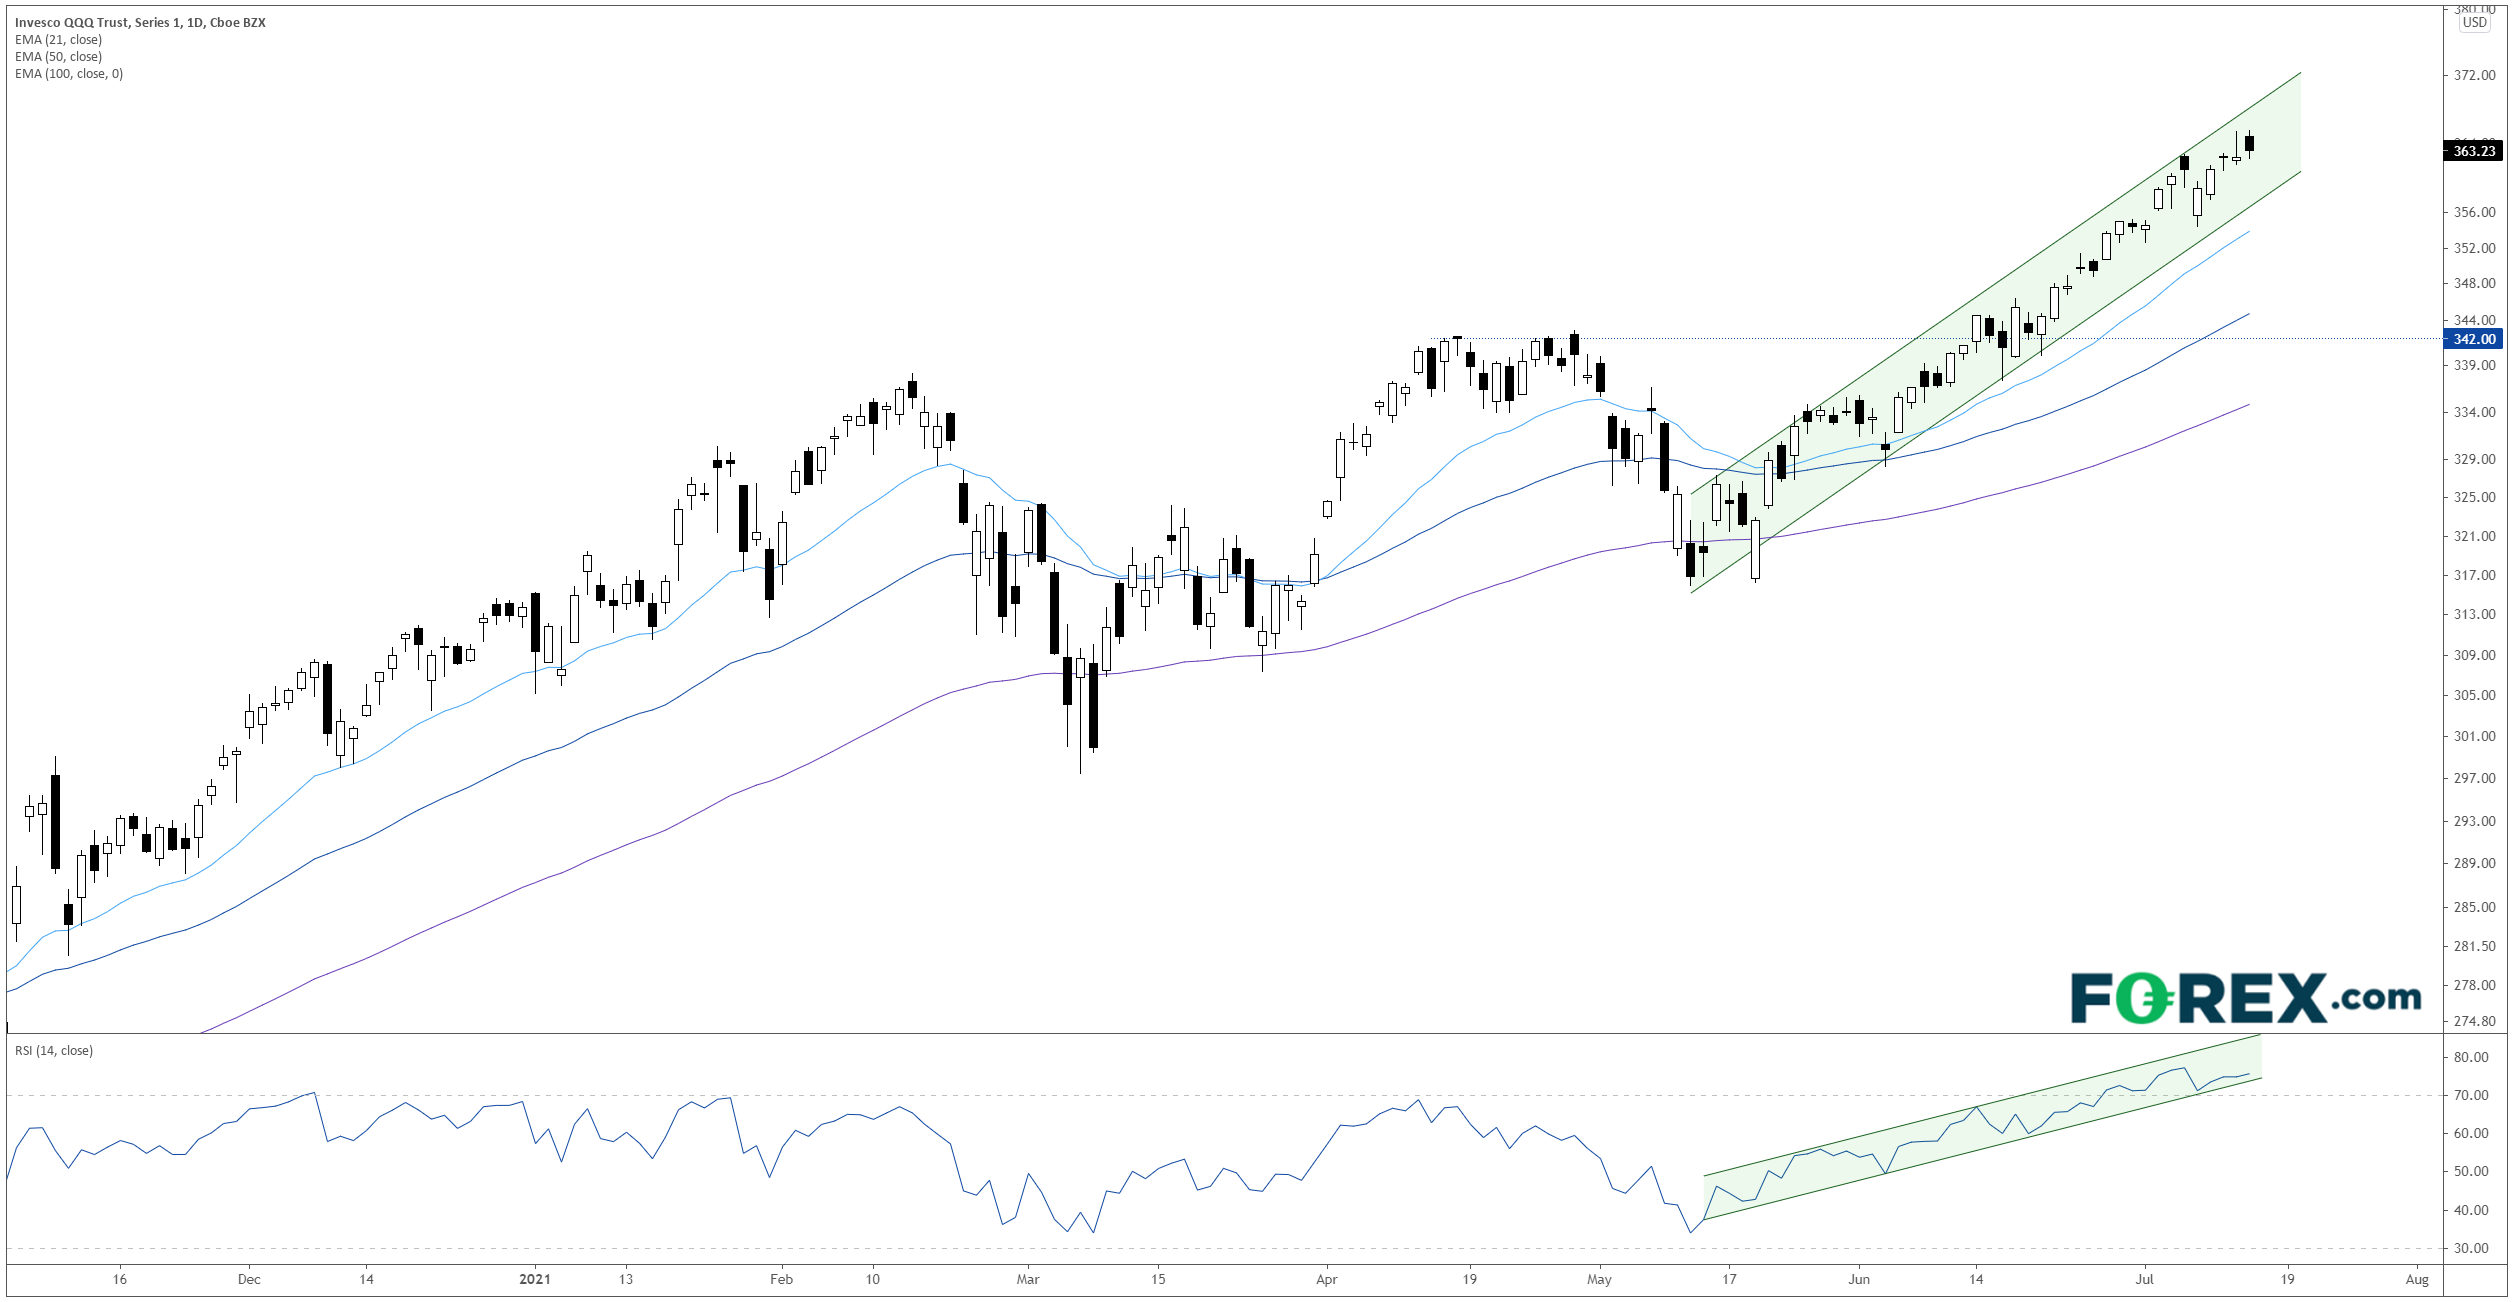
Looking at the chart below, the NASDAQ 100 is undeniably in a strong uptrend, with price rising above the upward-trending 21-, 50-, and 100-day EMAs. Over the last two months, the index has surged 15% in a tight rising channel formation, so as long as that pattern remains intact, the path of least resistance for the index remains to the topside for a potential test of the $380 area (the 200% Fibonacci extension of the Q1 pullback, not shown):

On the other hand, if we see a disappointing earnings season (or just a general loss of bullish momentum) and the 2-month bullish channel breaks, the NASDAQ 100 is likely to pull back toward previous-resistance-turned-support and the rising 100-day EMA in the $340 area.
Technicals have been the driving force for the technology-heavy NASDAQ 100 over the last couple months—now it’s time to see whether fundamentals can pick up the baton and keep the bullish momentum going.
Fusion Media or anyone involved with Fusion Media will not accept any liability for loss or damage as a result of reliance on the information including data, quotes, charts and buy/sell signals contained within this website. Please be fully informed regarding the risks and costs associated with trading the financial markets, it is one of the riskiest investment forms possible.

