It will be a busy week for the market, especially with the FOMC meeting and press conference on Wednesday afternoon and the quadruple witching on Friday. With that, I would be rather surprised to see the continued rebound in stocks we saw last week.
The NASDAQ has been the weaker index, and that is because the higher rates on the 10-year Treasury are compressing multiples, while breakeven inflation rates are helping to drive the reflation trade. However, I do not think any of this will last, as the bond market will be broadly disappointed by the Fed’s actions this week, and that will send yields on bonds greater than 2 years in maturity higher.
The bond market is trying to get to the Fed to respond to the higher-than-expected inflation readings coming out in recent weeks, and to this point, Fed Chair Jerome Powell has not been willing to respond. He is instead focused on maintaining the current monetary policy and driving inflation rates higher than 2%. However, the bond market believes inflation may become a problem and has been responding with rates on the longer end of the yield curve rising.
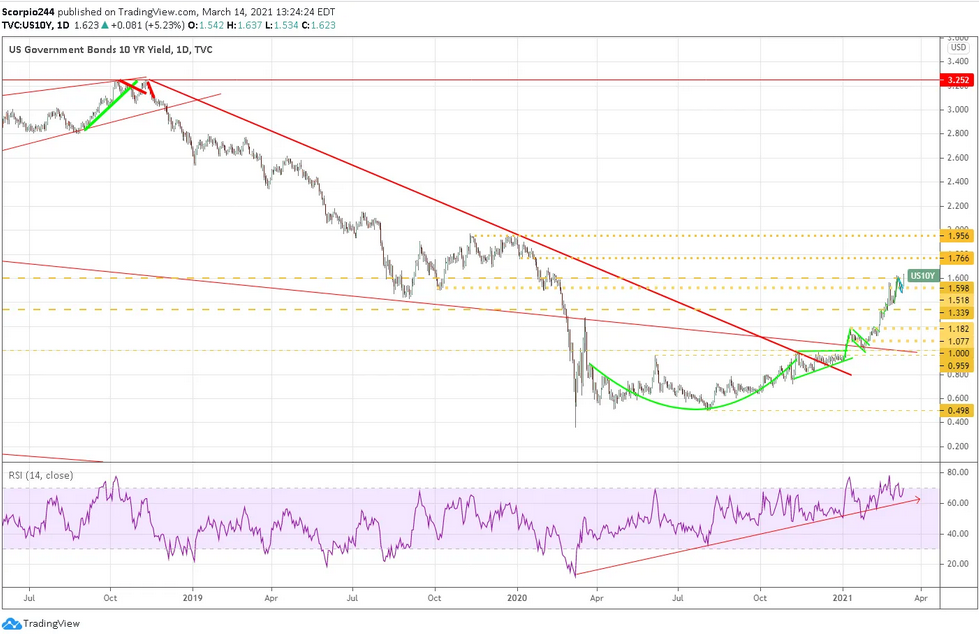 US 10 Yr Yield Daily Chart
Investors have been steadily shorting the 10-year note, expecting rates to continue to rise. We know this because the repo rate on the 10-year note is negative, which indicates that the demand for borrowing the note is high.
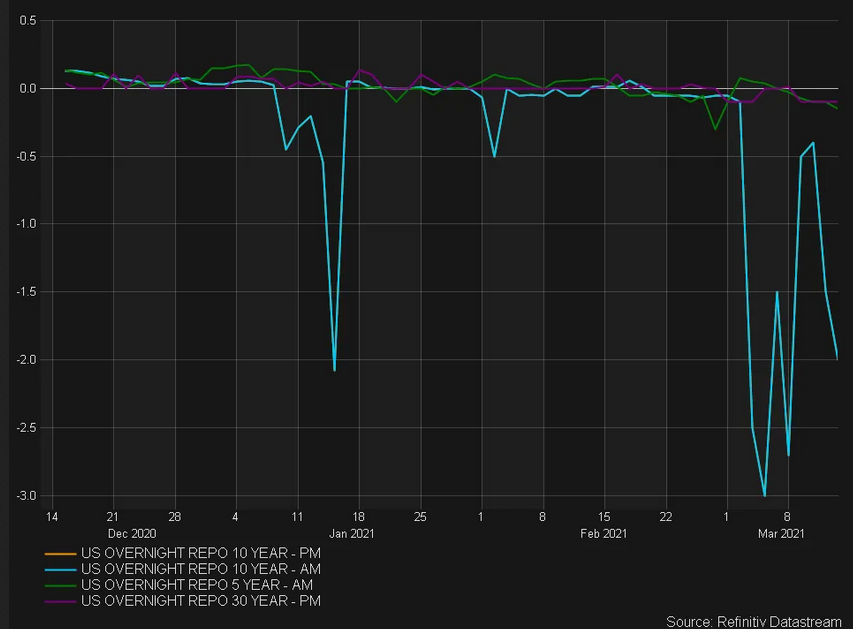 US Overnight Repo-10 Year PM Chart
The Fed appears to believe the recent rise in inflation readings as noted in the PPI will be transitory, which I believe too, meaning it will not last. But the bond market appears to think that these inflation rates may be more problematic, especially given the huge amount of stimulus coming. The Fed has indicated it wants inflation to run above 2% for some time before considering changing its current monetary policy.
I think it is unlikely that the Fed will make any comments regarding changes to its current monetary policy. As a result, the bond market may be unhappy with the results. This will likely send rates higher on the long-end of the curve, and Powell is likely not to be bothered as long as overall financial conditions remained orderly.
Therefore I am getting concerned we could have a repeat of the Fall of 2018, when the market wanted the Fed to pivot from a tightening to an easing stance. This time I believe the market will want the Fed to pivot from ultra dovish and indicate it will beat down any inflation threats and have control over where yields go.
This creates a risk for the equity market because any indication that rates will rise or the Fed will taper its asset purchases could derail the bull run. Additionally, if the Fed does nothing, bonds will continue to rise, and the dollar will strengthen, also derailing the bull run. The only thing that will appease both markets is if the Fed commits to more QE purchases and targets the longer end of the curve, a form of yield curve control, I do not believe that is coming.
S&P 500
My biggest worry is a drawdown in the S&P 500 (SPY) back to 3,300 or worse, 2,860 level. From the bottom to top, a 38.2% retracement would lead us to a gap fill at 3,300, while a 61.8% retracement would lead us back to a gap fill at 2,860. It would breakdown from a well-formed bearish rising wedge pattern.
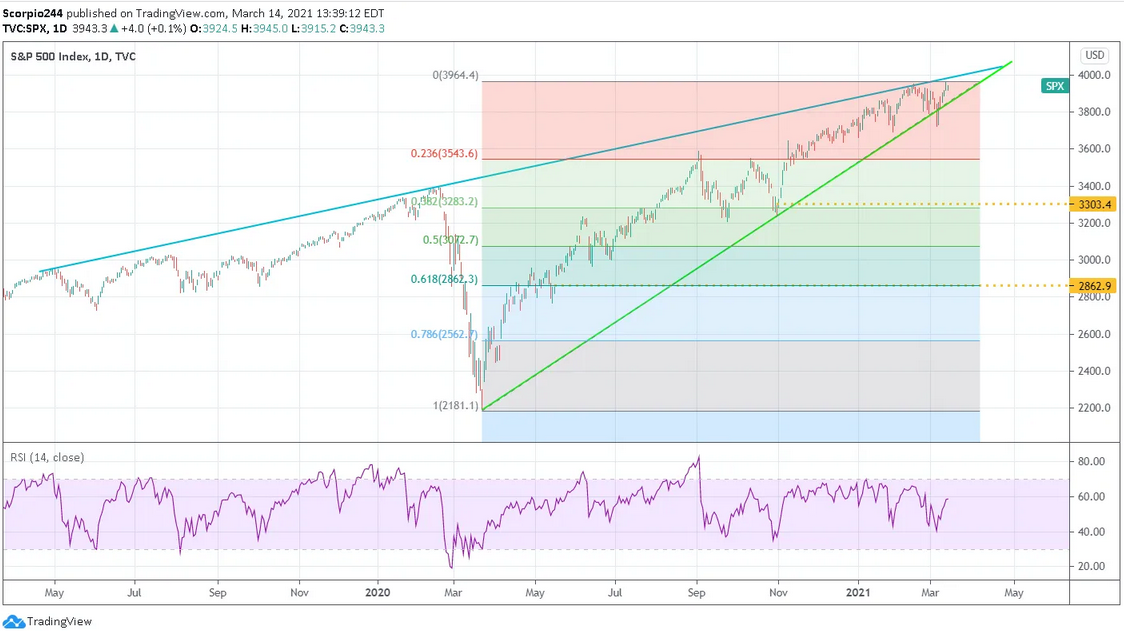 S&P 500 Index Daily Chart
NASDAQ 100
The uptrend in the NASDAQ 100 ETF—Invesco QQQ Trust (NASDAQ:) off the March 2020 lows has already been broken and may be a leading indicator.
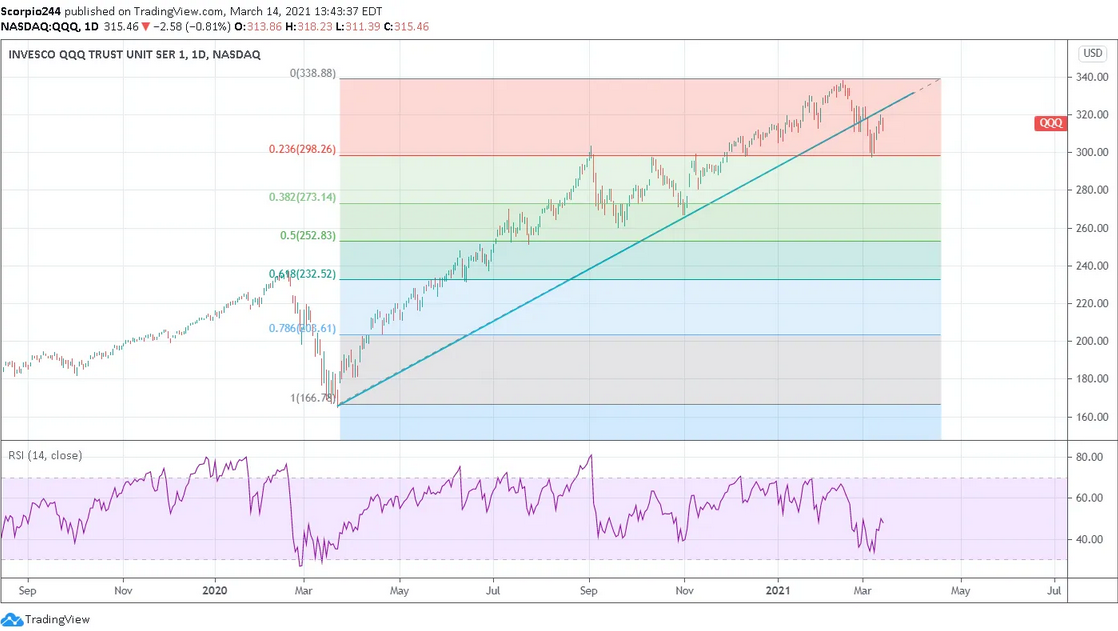 QQQ Daily Chart
Amazon
Amazon (NASDAQ:AMZN) had a nice rebound last week, but the trends are still lower for the stock. Support at $3,070 held most of last week, but I think that support level will break this week and send the stock back to $2,870 over the next few weeks.
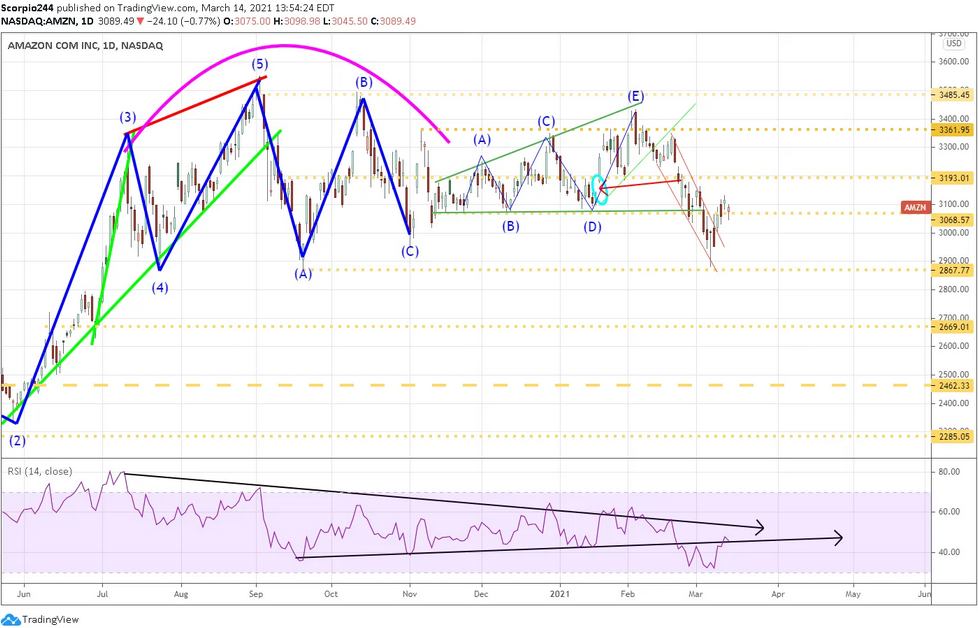 Amazon Inc Daily Chart
Alibaba
Alibaba (NYSE:BABA) continues to look weak, with an RSI trending lower and still not oversold. It seems like a drop to $211 is in the stock's future.
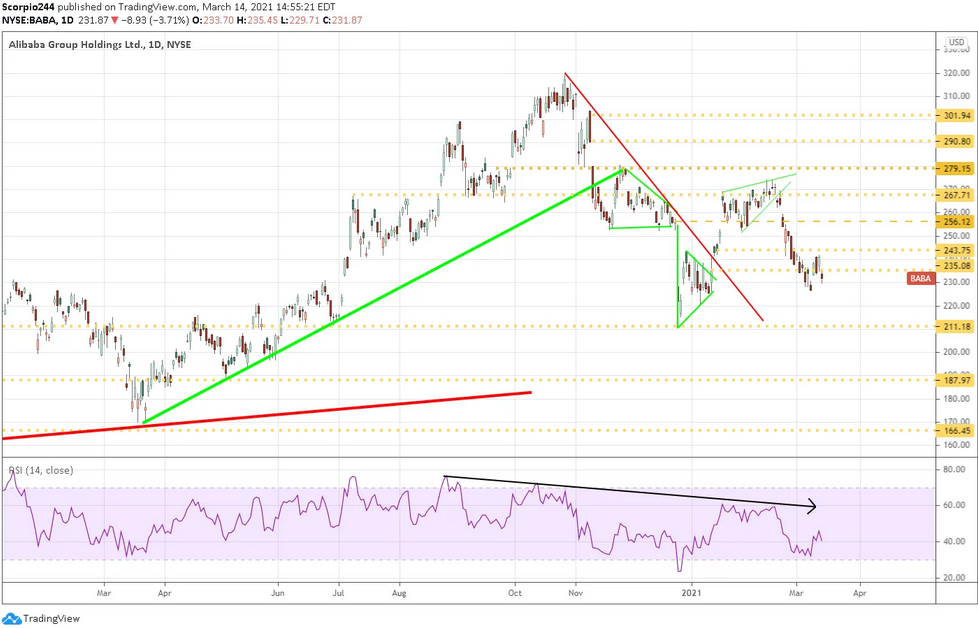 Alibaba Group Daily Chart
Caterpillar
Caterpillar (NYSE:CAT) has had an amazing run; I guess we aren’t worried about trade wars anymore. The stock looks like it is getting toppy here, with an RSI around 70 and a bump and run pattern present. Perhaps a decline back to $200 is in order?
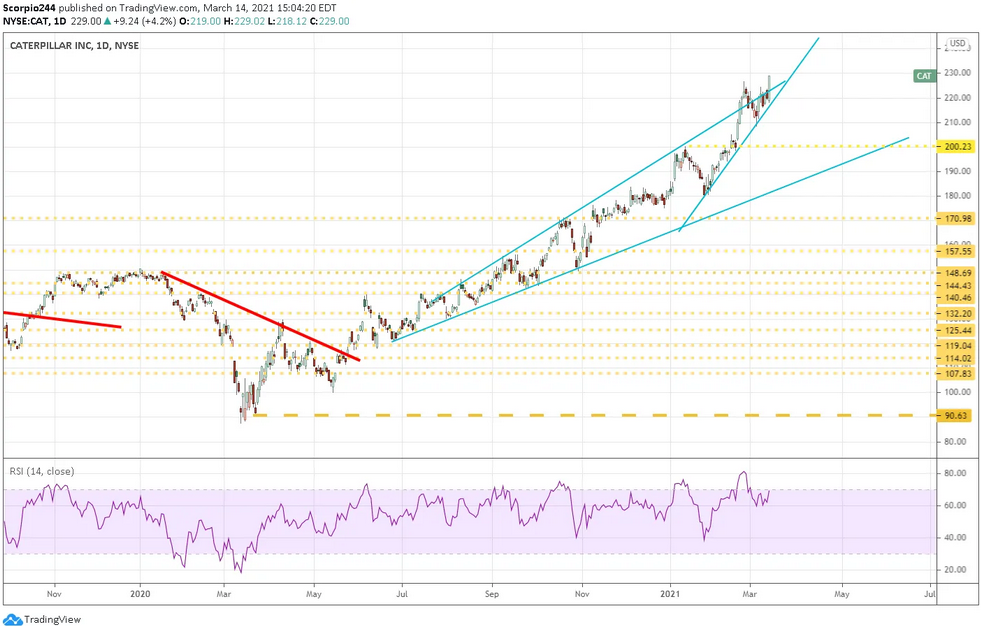 Caterpillar Inc Daily Chart
Advanced Micro Devices
Advanced Micro Devices (NASDAQ:AMD) looks horrible, and the only thing stopping it from falling to $62 is support at $74. How long it will take, I am not sure, but I wouldn’t be surprised to see this one at $62 in the next few weeks.
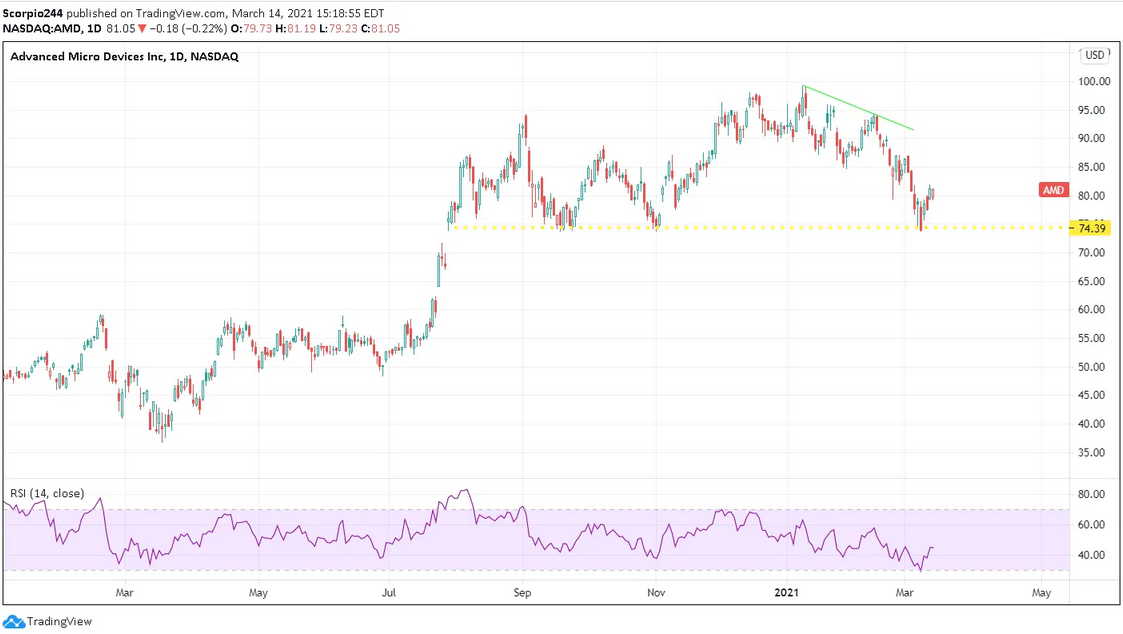 AMD Daily Chart
ROKU
Is Roku (NASDAQ:ROKU) finished falling yet? I don’t think so. It could have much further to go from here.
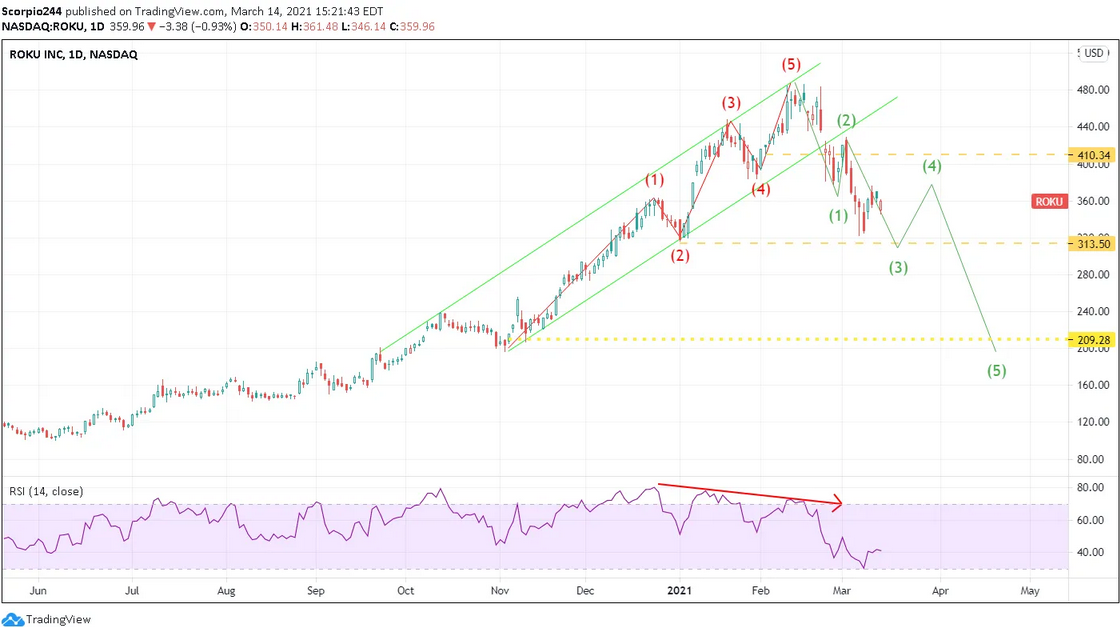 Roku Inc Daily Chart
