Market Rallies To All-Time Highs
Well, that was undoubtedly an exciting bought of volatility. , we reviewed our “signals” and the sell-off.
“Well, not only did the highs not stick, but the 50-dma failed during Friday’s sell-off. The market closing at its lows suggests we could see some more selling early next week. The “good news,” if you want to call it that, is that the “sell signal” is moving quickly through its cycle. Such suggests that selling pressure may remain limited and may resolve itself by the end of June.”
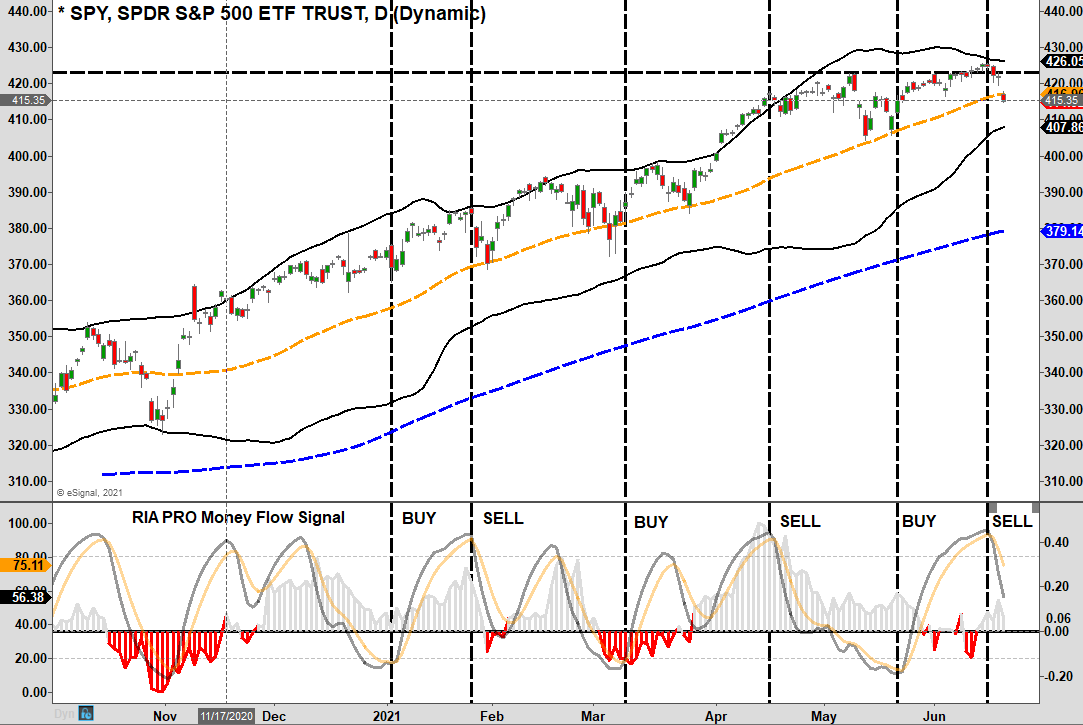
Well, this week, the market not only got off the mat but rallied back to new highs, just barely, as shown below.
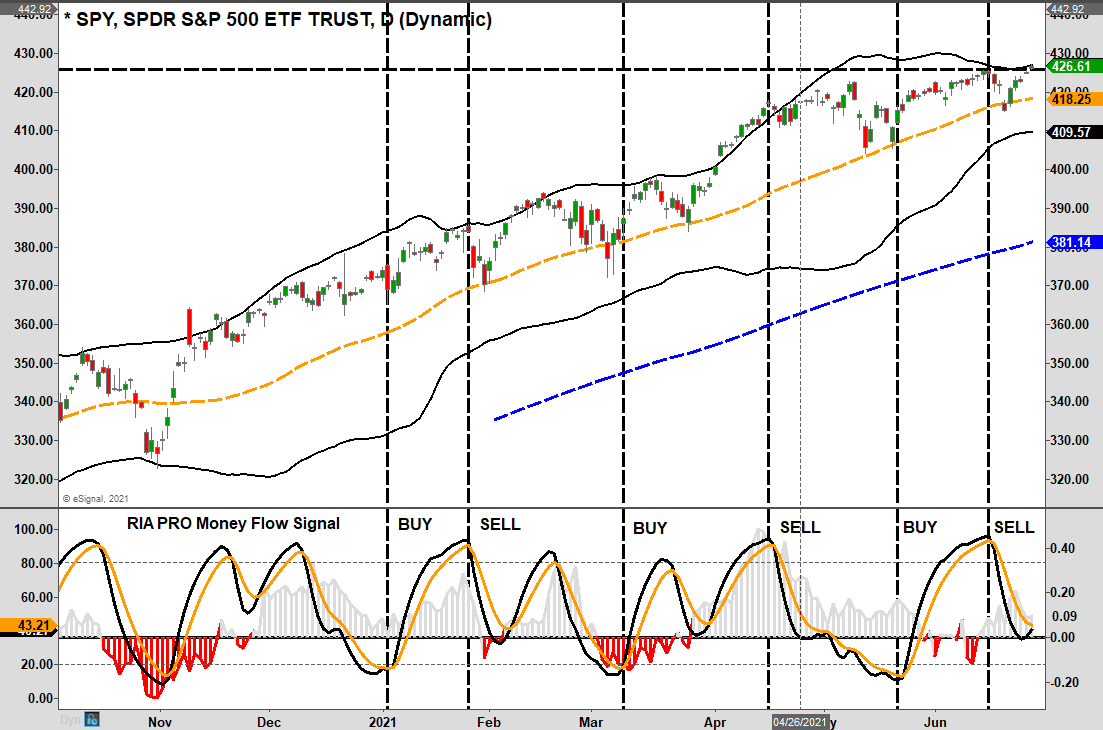
While the rally did get the “bulls” motivated, the declining “money flows” (grey histogram chart) suggest the rally is unlikely to stick. With the market back to 2-standard deviations above the 50-dma, conviction weak, and investors extremely bullish, the market remains set up for more consolidation or correction in the week ahead.
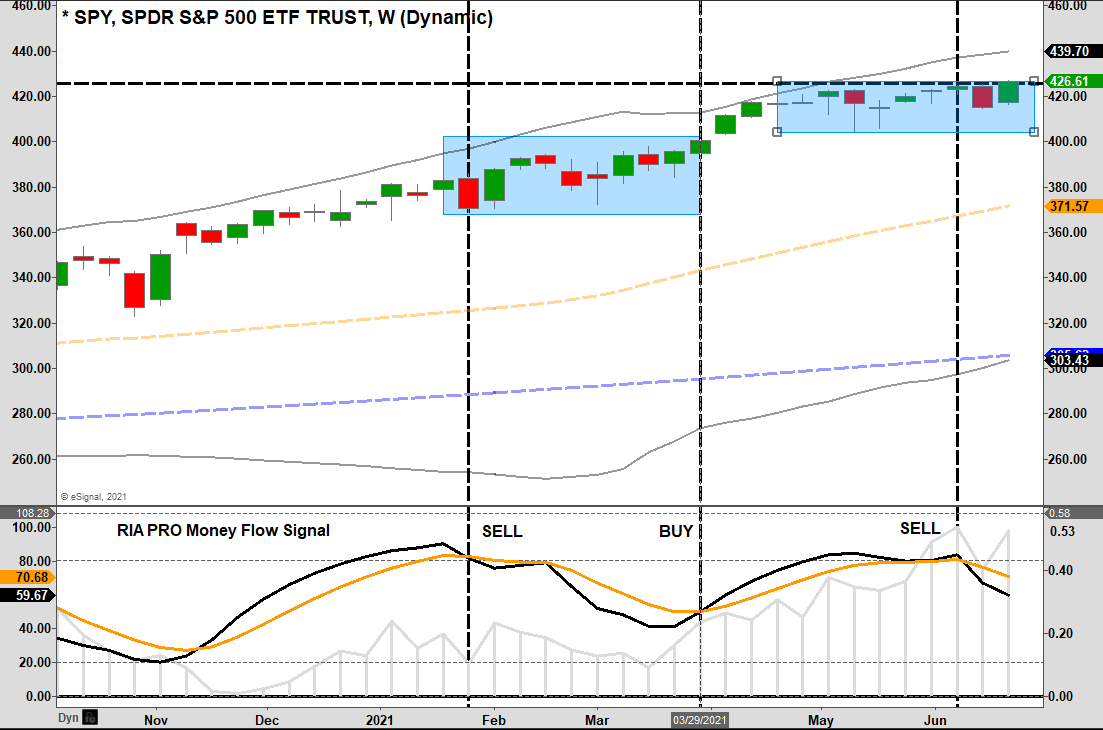
The weekly chart confirms the same. Our previous discussions warned that if the daily and weekly “sell signals” align, such often coincides with more “corrective” rather than “consolidative” actions. If the “daily” signal triggers a “buy” next week, such would indicate a limit to the upside, and more consolidation.
I got a few emails this week asking if I still think a 5-10% correction is possible?
The short answer is “yes.” However, it is not a guarantee that such will happen. If you notice in the weekly chart above, the market can consolidate over an extended period and reduce the “sell signal.” A “correction” makes it happen faster. It is also worth noting that corrections can come after “sell signals” are triggered. Thus, they are not always immediately correlated.
Sell Signal Conundrum
As we have laid out repeatedly over the last few weeks, there are several important points concerning technical analysis.
- Technical analysis is not always 100% accurate. We look for our indicators to be correct about 70% of the time, providing better risk management.
- Signals do not mean to be “all-in” or “all-out” of the market. As discussed, we reduced “risk” previously but still maintain a healthy exposure to markets.
- Just because the correction didn’t happen immediately doesn’t mean it won’t.
The last point I expand on in our latest 3-minutes video.
There are two other reasons we are cautious of this past week’s rally.
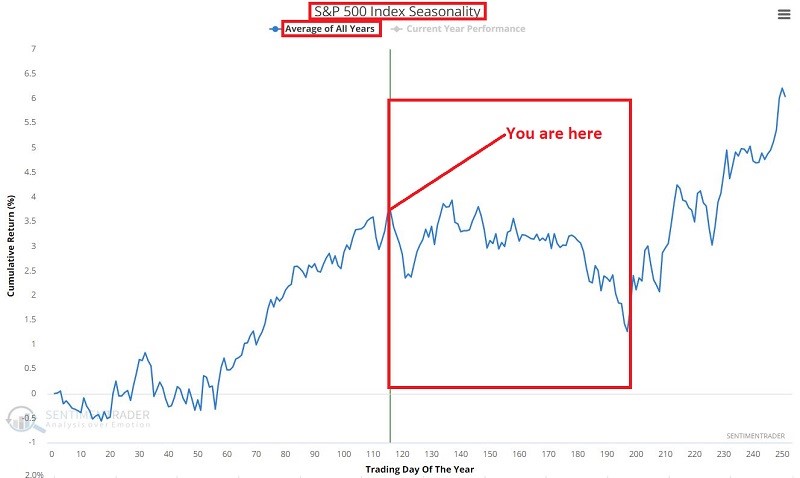
Volume was lacking, and seasonality is still at play.
“The implications are that we may see:
- A downdraft of some significance in the near-term
- Not a lot of new upside in the months ahead
- And a potentially bigger decline as we head into mid to late October
Is that how it will play out? Sorry folks, ‘climate, not weather,’ remember?
The stock market could easily rally to nominal new highs in the month ahead. However, do also note in the chart below that the Index has tracked its annual season fairly closely (in terms of the trend – and to a much greater magnitude) so far in 2021.
Will this continue? Same answer as the question above.” – Sentiment Trader
That view supports our current thesis of remaining slightly underweight equities for now. The market is likely to rally a bit from here for two reasons:
- End of the quarter “window dressing” by portfolio managers.
- The first two weeks of July tend to be seasonally strong before weakness reasserts itself.
We suggest remaining a little cautious but not overly defensive for now.
Bullishness Is Back
One thing about the market is the rather extraordinary amount of “bullish exuberance.” That exuberance often gets visualized, for example, by record margin debt levels.
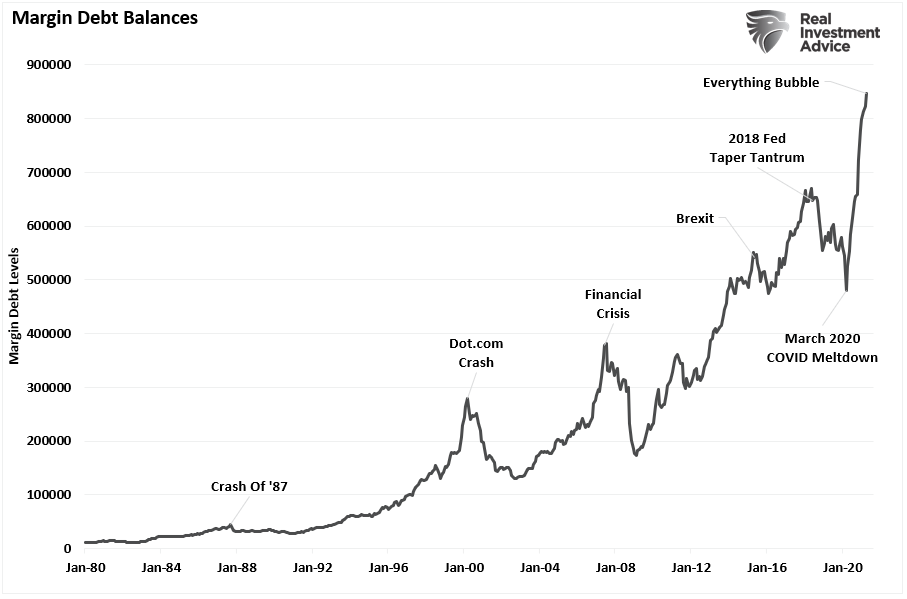
However, some other “non-mainstream” indicators show the same. For example, a new survey from Natixis shows a clear example of “” at work.
“Wealthy Americans are pretty optimistic about their long-term investment returns, expecting to earn average annual returns of 17.5% above inflation from their portfolios.
That’s according to a new survey from Natixis that surveyed households that have over $100,000 in investable assets in March and April of 2021.”
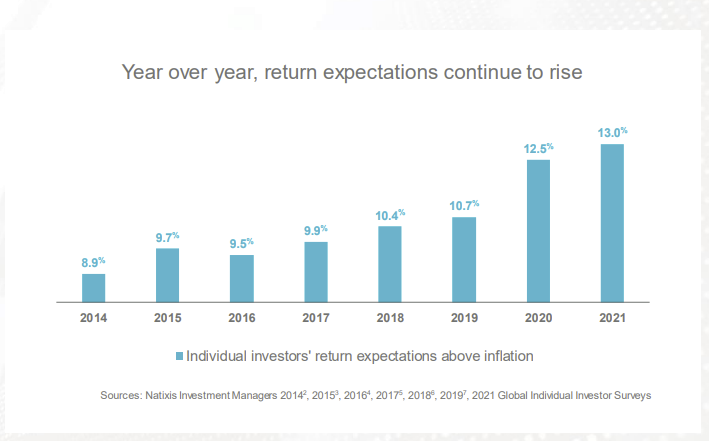
Of course, with inflation running roughly 5% in the second quarter, such suggests that investors are looking for more than 20% from the stock market by year-end.
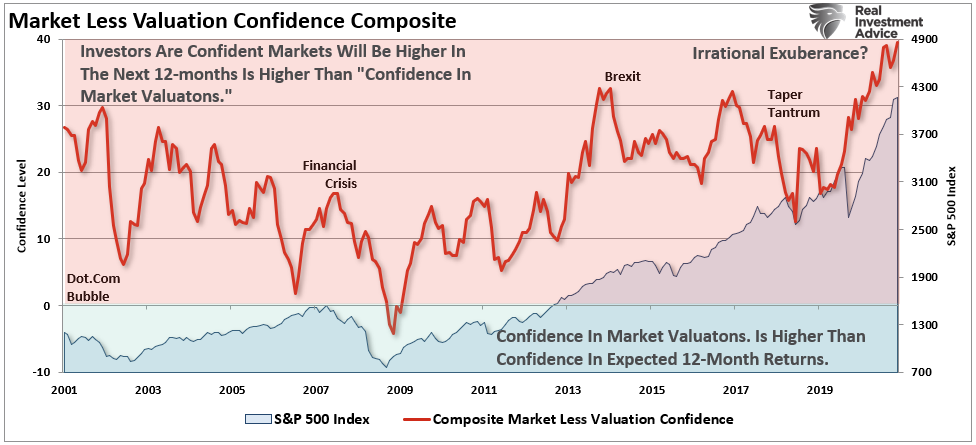
But it isn’t just “recency bias.” It is also the “” driven by the belief the Fed will continue to support markets indefinitely. The Bespoke “irrational exuberance” indicator subtracts the “Valuation Confidence” from the “One Year Confidence” survey data. This reading has exploded higher recently for both institutional and individual investors.
“When the reading is positive, it means confidence that the market will be higher one year from now is higher than confidence in the valuation of the market. The opposite is the case when the reading is in negative territory.” – Bespoke
The key takeaway is that “investors simultaneously believe the market is over-valued but likely to keep climbing.”
Why? Because the “Fed has investor’s backs.”
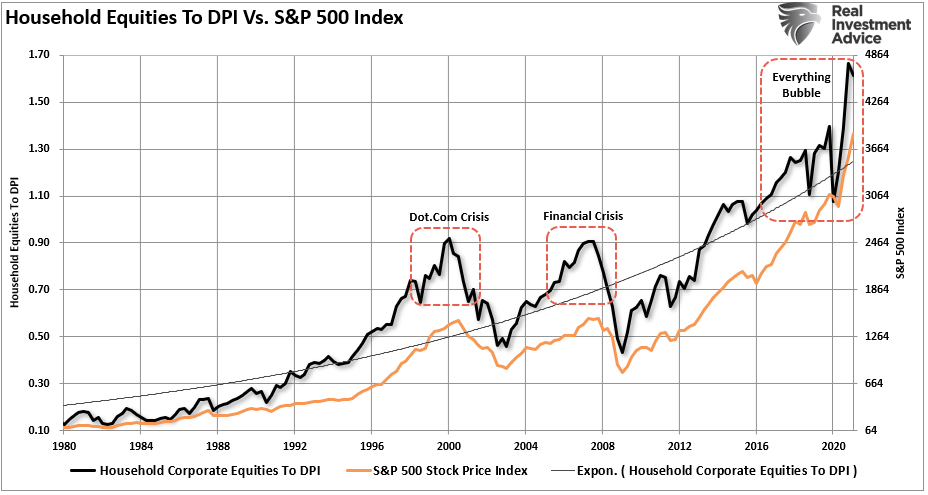
Of course, we would be remiss not to look at the level of household equity ownership as a percentage of their disposable personal income. The current deviation from the long-term exponential growth trend rivals every previous bubble in history.
Yes, this time could be different. But, unfortunately, it just usually isn’t.


