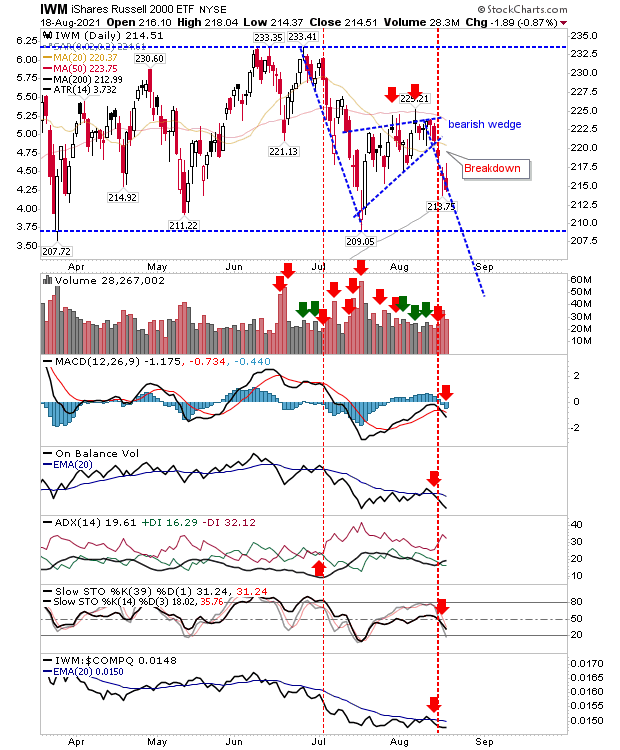
Wednesday’s news was not the continued losses from the bearish wedge in the as such losses have remained contained by the trading range. Before moving on, the Russell 2000 (via ) does have the 200-day MA to look for as a possible positive test despite the net bearish technical picture.

IWM Daily Chart
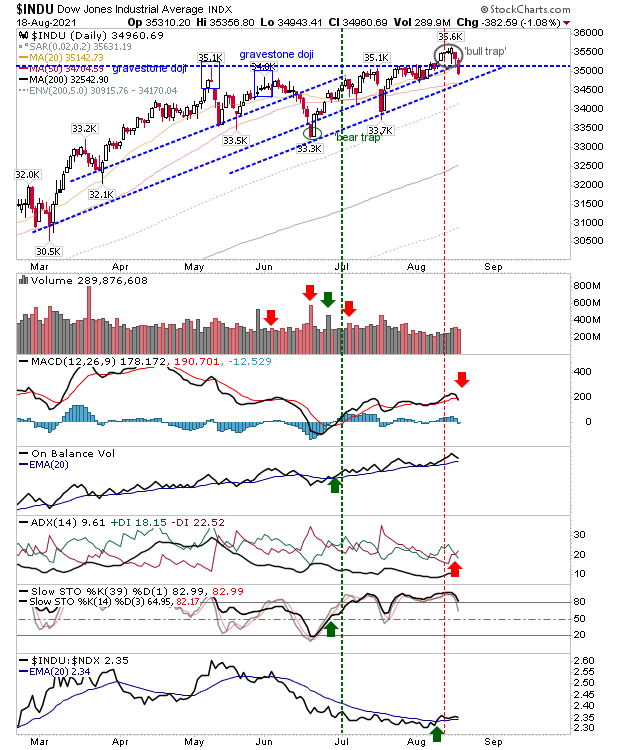
Yesterday it was the which was perhaps the most disappointing. It had finally marked a breakout after a 3-month consolidation, which should have set it up for a nice run.
However, Wednesday saw this breakout get washed away with an undercut and close below breakout support. Yesterday’s loss came with a ‘sell’ trigger in the MACD and ADX.
Despite this, it’s not totally a goner. The index is outperforming the and will soon be testing its 50-day MA. ‘Bull traps’ tend to be powerful topping patterns and if this evolves into something worse it will spell bad news for the and probably the too.

DJIA Daily Chart
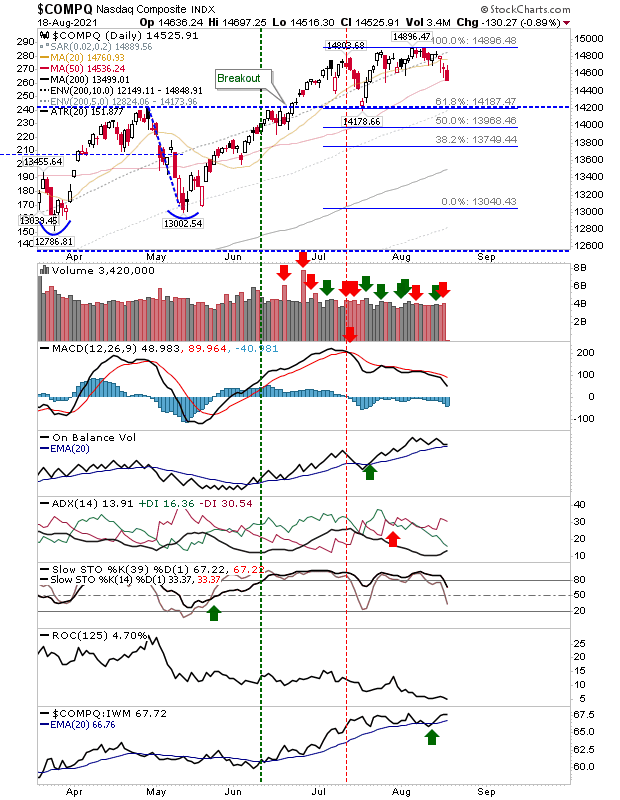
The NASDAQ took a loss to take it to its 50-day MA, but remains well above June breakout support. Look for an intraday spike below its 50-day MA but a close above as I would expect to see some form of positive test here.

COMPQ Daily Chart
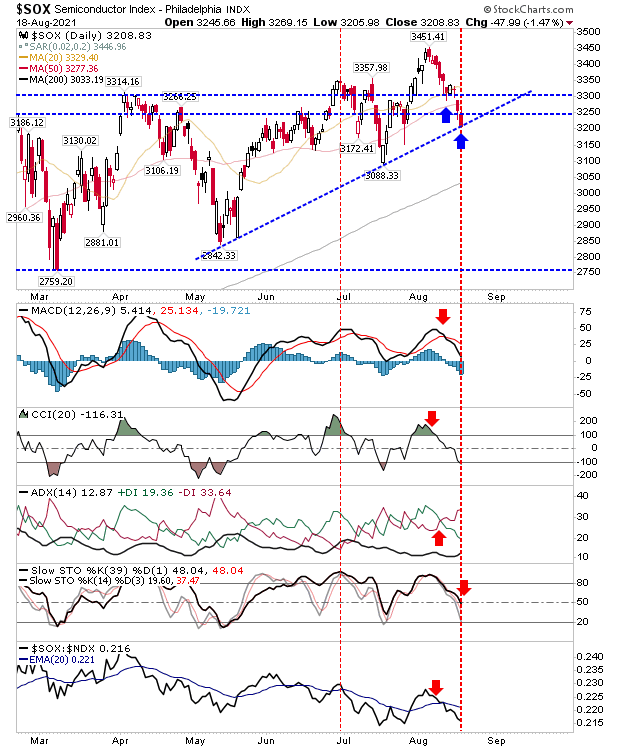
The is in a last chance saloon with rising support the only thing separating the index from its 200-day MA. The larger issue is that the index is back inside the prior consolidation, negating the breakout and setting up a likely move back to support of the March swing low. Technicals are net negative, confirming the weakness.

SOX Daily Chart
While weekly charts aren’t showing a whole lot of damage in the markets, but we do have a scenario where there is little incentive for sideline money to step in and buy ‘value.’
Pullback ‘buys’ require a clear trend to feed into this and the July swing low was that opportunity, but there was no continuation of the rally when it came to challenging the all-time high. Defensive sectors remain the best chance for longs; I am tracking some here.
Fusion Media or anyone involved with Fusion Media will not accept any liability for loss or damage as a result of reliance on the information including data, quotes, charts and buy/sell signals contained within this website. Please be fully informed regarding the risks and costs associated with trading the financial markets, it is one of the riskiest investment forms possible.

