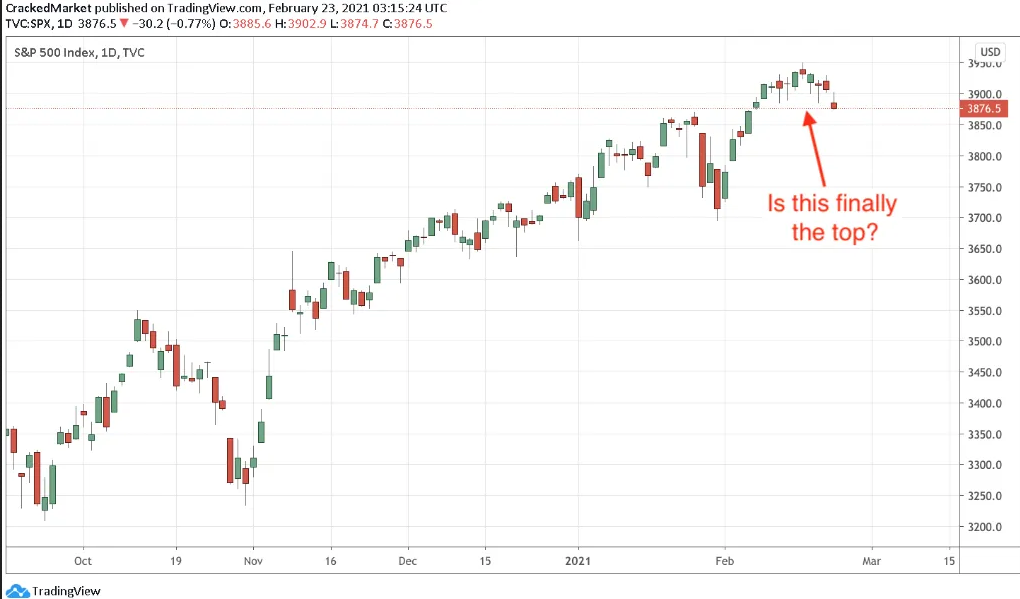
 S&P 500 Index Daily Chart
The S&P 500 slipped for the fifth consecutive session and Monday’s losses were the worst yet. That said, this -0.8% “tumble” still leaves us little more than 1% from all-time highs. (Hardly panic material.)
As boring as the market has been the last few weeks, things have started getting a little spicier:
- Bitcoin exploded higher and nearly hit $60k Sunday…before tumbling 20% Monday.
- The surge in 10-year Treasury yields has doubled from last year’s lows. (Most people blame this latest stock market wobble on the rise of interest rates.)
- And few stocks are taking this rise in rates worse than the highflying FAANG darlings, with most of them down between 10% and 15% from their highs. (Alphabet (NASDAQ:GOOGL) is the lone exception but it is doing its best to catch the others.)
Last week I said this recent bout of selling wasn’t meaningful and Monday’s loss doesn’t change my mind.
While this selloff could be the real deal, odds are strongly against it. If something bounces two dozen times and it reverses only once, what is the most likely outcome of any individual occurrence? As obvious as the answer seems, every time prices slip from the highs, people reflexively start calling it a top.
While these naysayers will eventually be right, like a broken clock, they will be wrong dozens of times first. Is this the one time they get it right? Probably not.
That said, I’m not willing to ride this one all the way down if I’m wrong. I have clearly defined stops in the mid 3,800s and if the market falls to those levels, I’m out, no questions asked.
And you know what, I actually hope I’m wrong because a larger pullback would create far more profit opportunities than if this is just another minor dip and bounce.
I’m holding for higher prices until my stops are hit. And if I’m wrong, even better!
Leave a comment