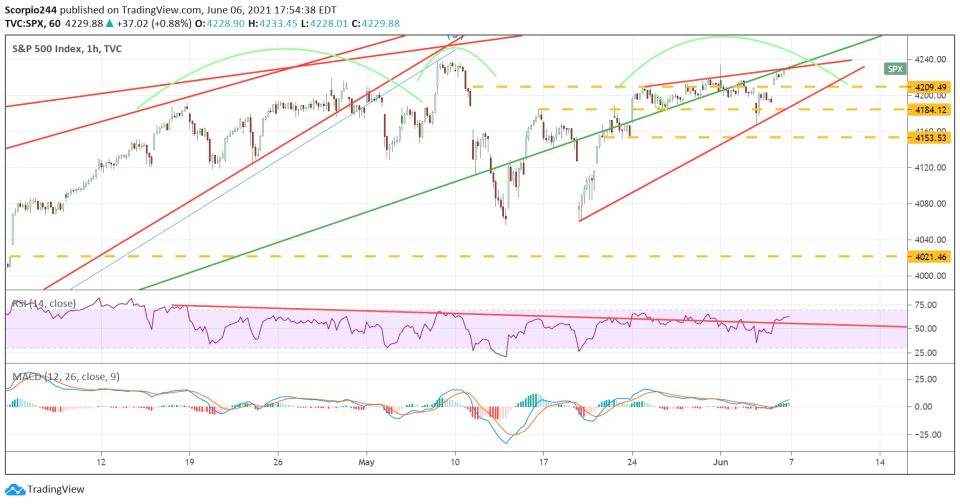
This week will be a less busy week for stocks. But unlike last week, this week is likely to tell us if stocks can really advance or if something has changed. The managed to rise last week and got very close to taking out the previous highs but failed to do so. There is now a huge gap that needs to be filed down at 4,195, while plenty of gaps below that.
But below the surface of the technicals, there appears to be something else taking place. Risk-off sentiment is creeping into the housing sector, and the Dow Transports. As I noted in this week’s tactical update, this could be due to a change in trends that are taking place in inflation expectations.
An easy way to track inflation expectations is to use the ETF. The ETF has been trending lower in recent weeks, and it would seem that the and the are following expectations more generally.
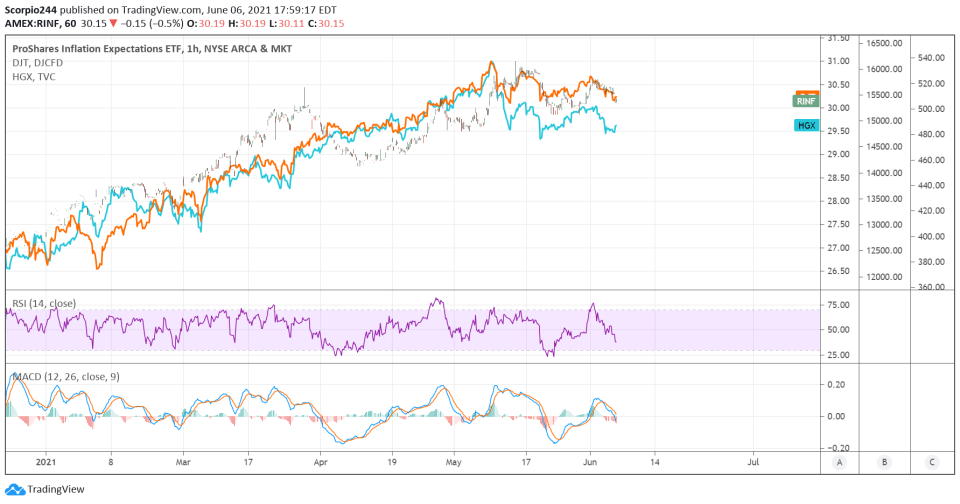
It is a noteworthy change in trend because the S&P 500 has largely been trading in line with inflation expectations, and this could trigger a broader risk-off signal over time.
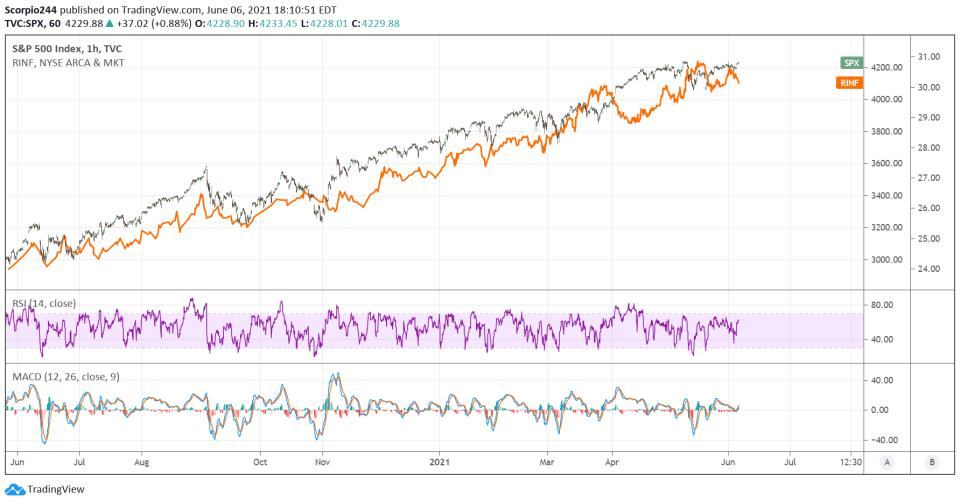
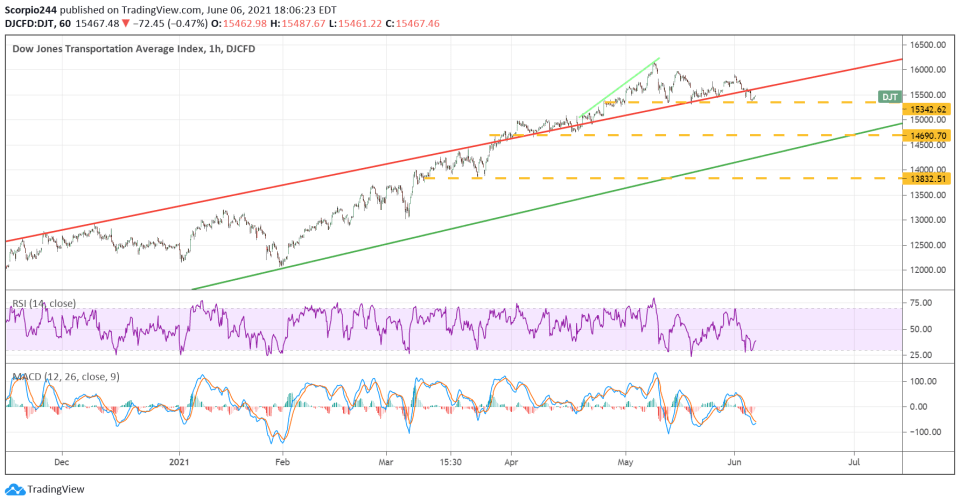
It makes the price action in the Dow Transport this week more important than the price action in the S&P 500. If the transports begin to really break down, it is likely an indication that the cyclical reflation trade is beginning to break down.
Dow Transports
The Transports are sitting on key support and uptrend at 15,340. A break of that uptrend and support level would indicate that lower prices are to come, resulting in the transport falling back to 14,690. If this were to occur, as the S&P 500 went on to make new highs, it would be a significant divergence similar to what was seen in September of 2018.
FedEx
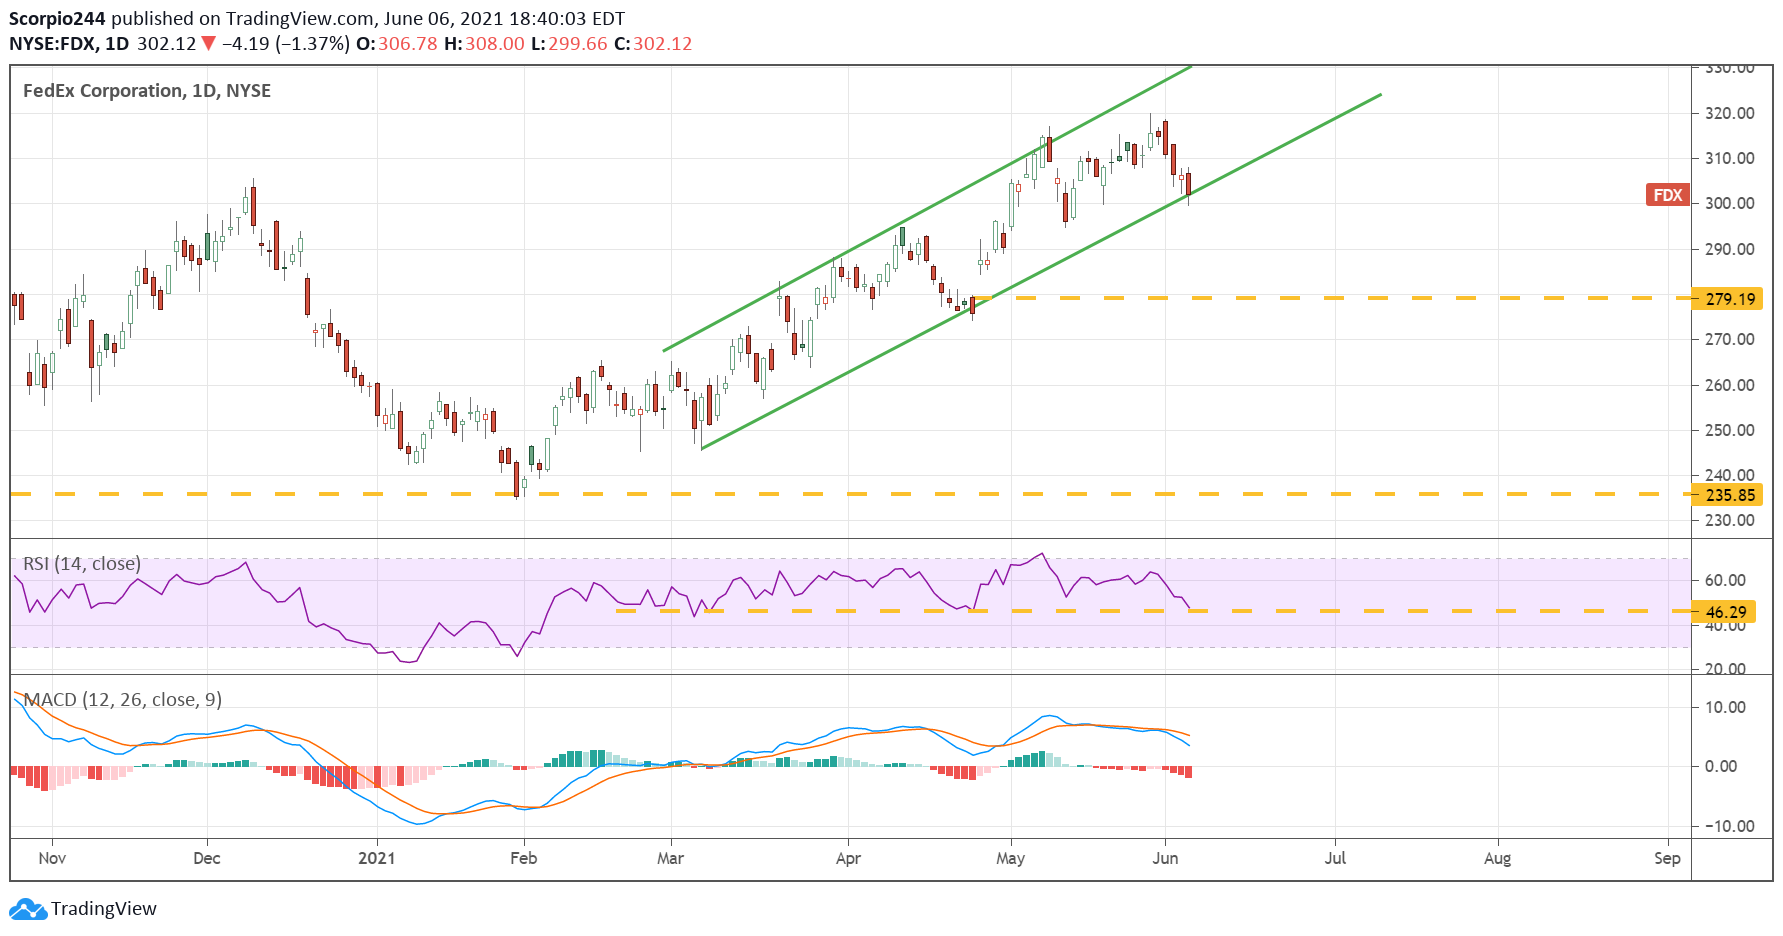
FedEx (NYSE:) needs to be on everyone’s radar because it too is sitting on an uptrend that, if broken, is likely to lead to a sharp decline, potentially back to $280.
UPS
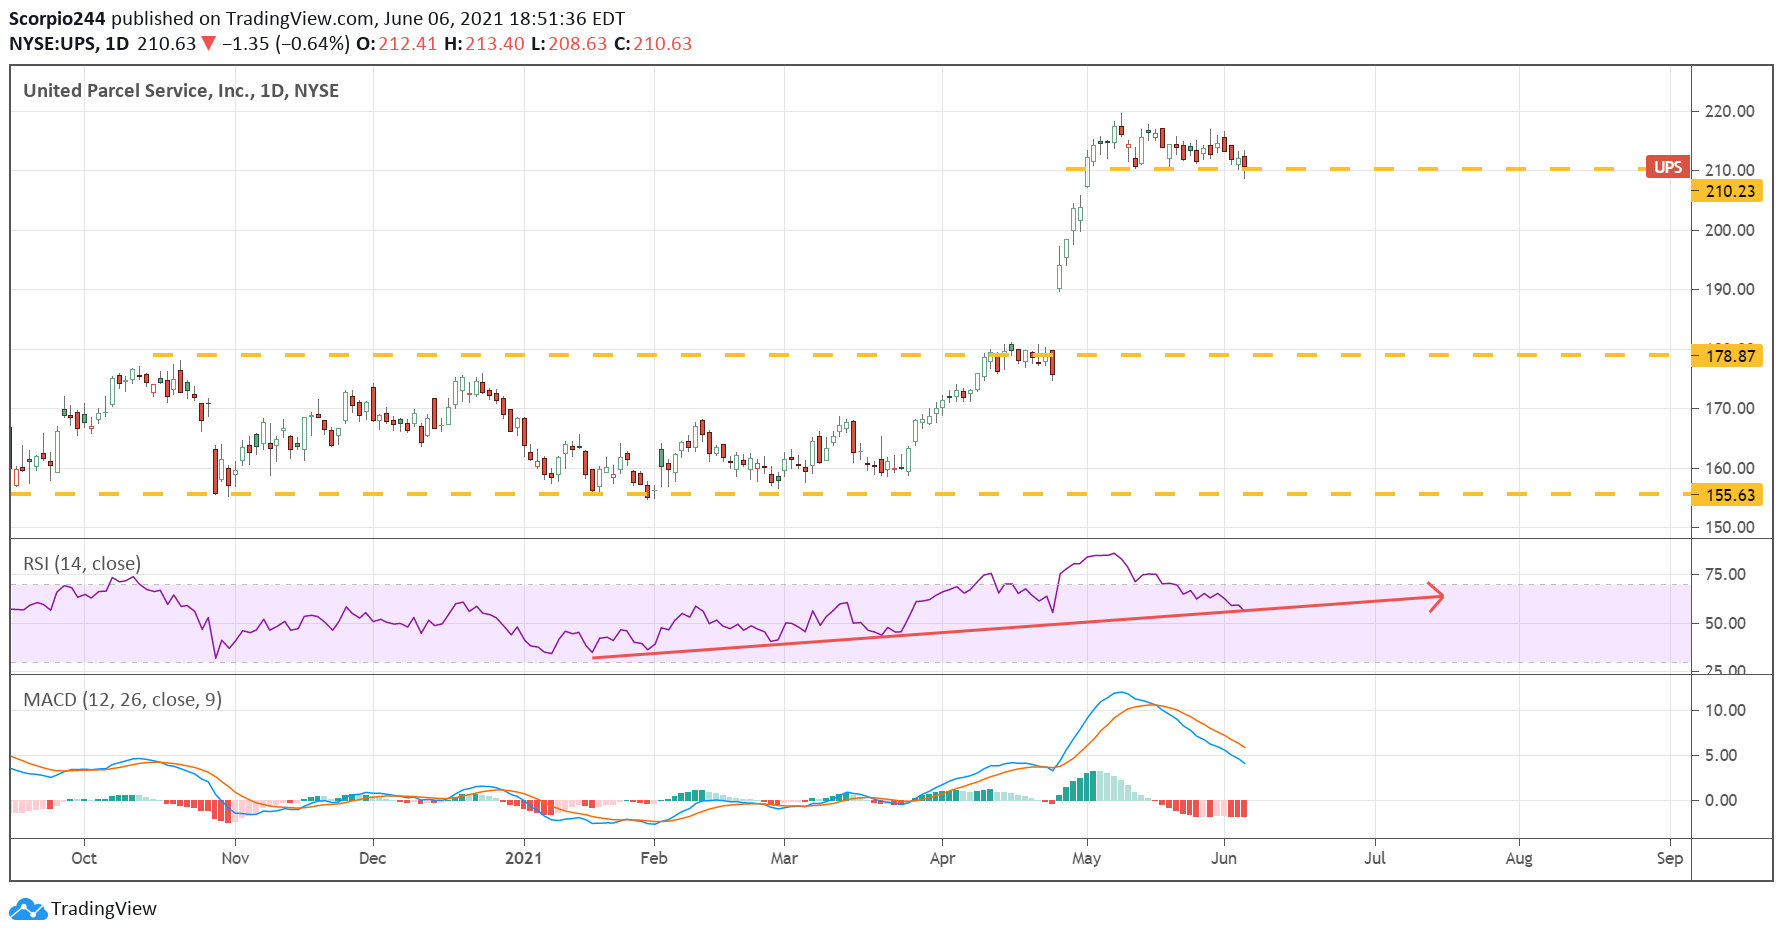
United Parcel Service (NYSE:) has also stalled out recently and finds itself on key support at $210. There is a rather large gap that is still waiting to be filled down at around $178. We can also see that the RSI is trending lower and very close to breaking an uptrend; this would be a big negative.
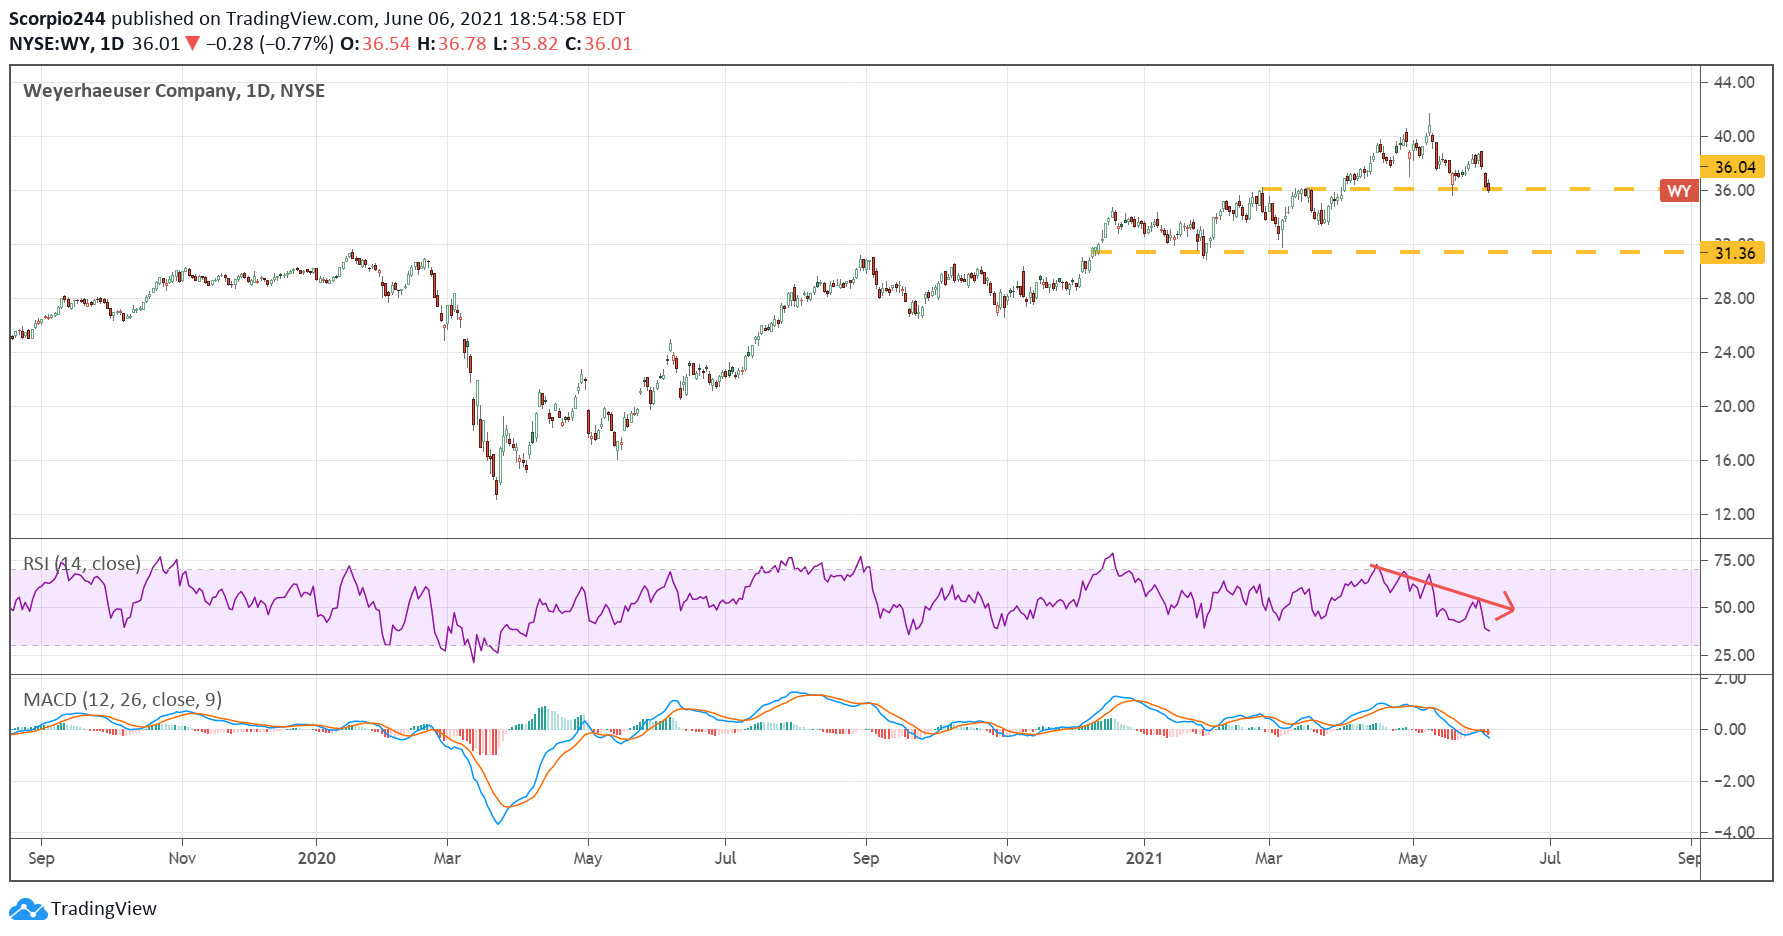
Weyerhauser
Weyerhaeuser (NYSE:) is in the PHLX Housing Index and is showing signs of weakness. The stock is also resting on key support at $36, which needs to hold. However, the RSI is now trending lower, a sign of bearish momentum taking hold. A break of support at $36 likely sends the shares lower to $31.50.
Owens Corning
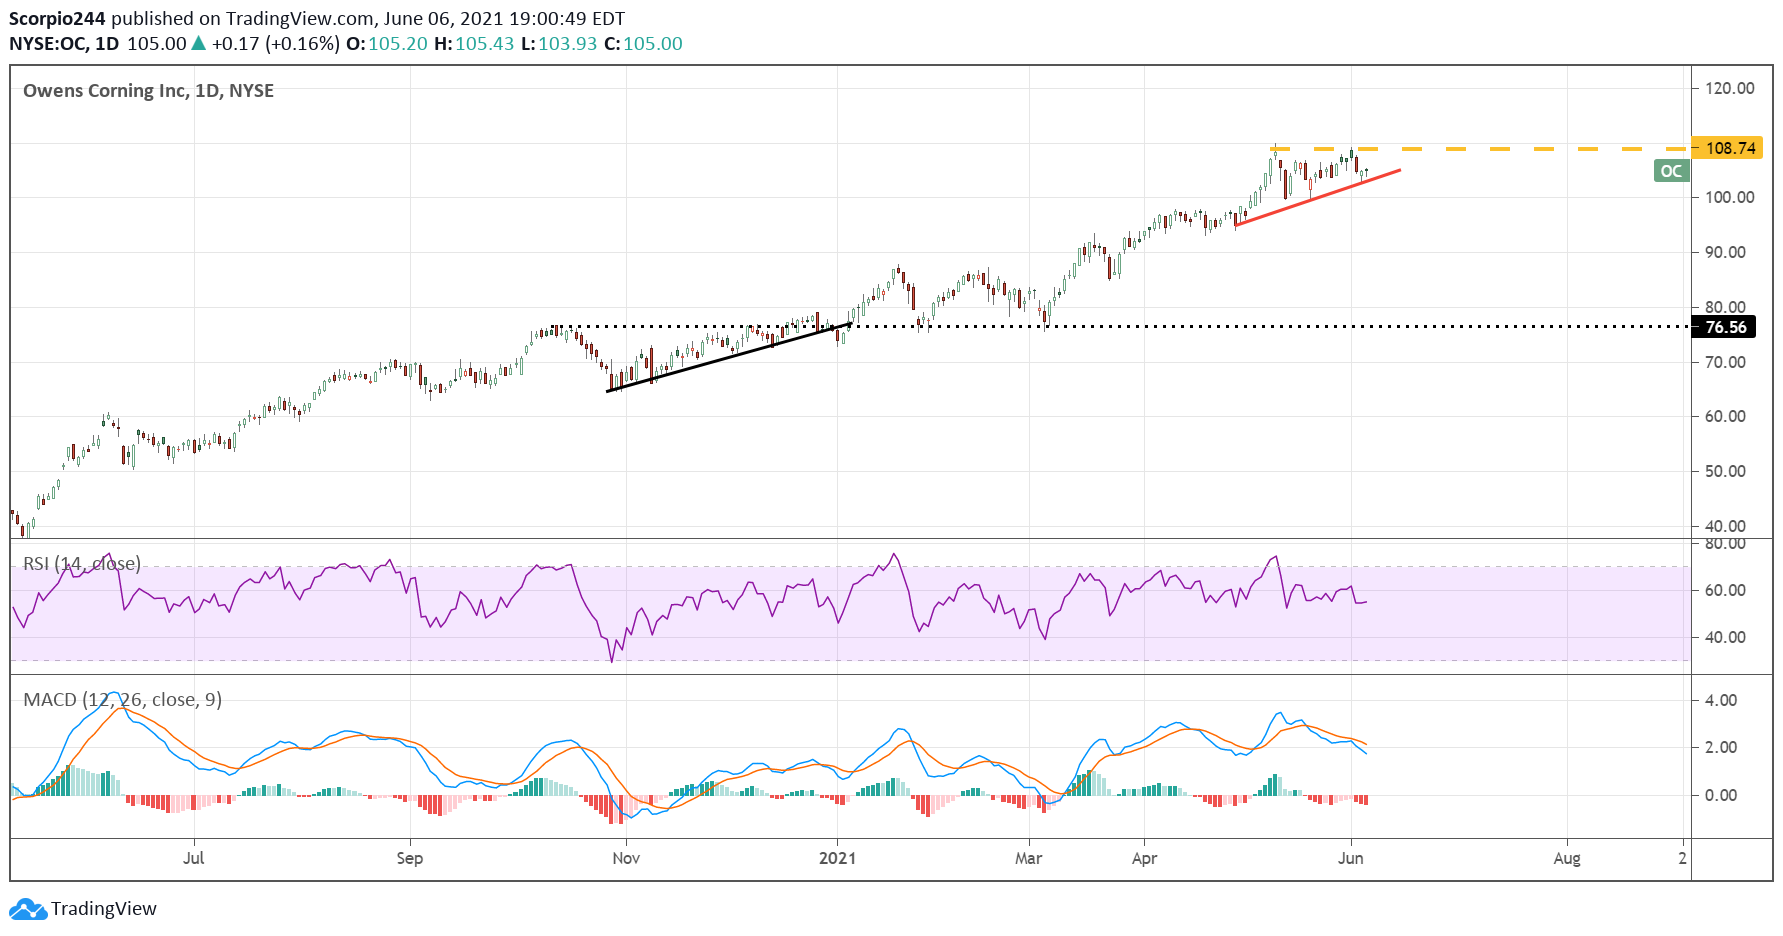
Owens Corning Inc (NYSE:) has been trending higher and bumping up against resistance at $108.75. A breakout could mean much higher prices for this stock, maybe as high as $120. However, the trends in the RSI and the MACD are not favorable to a breakout as they begin to show signs of a bearish divergence.
Vulcun Materials
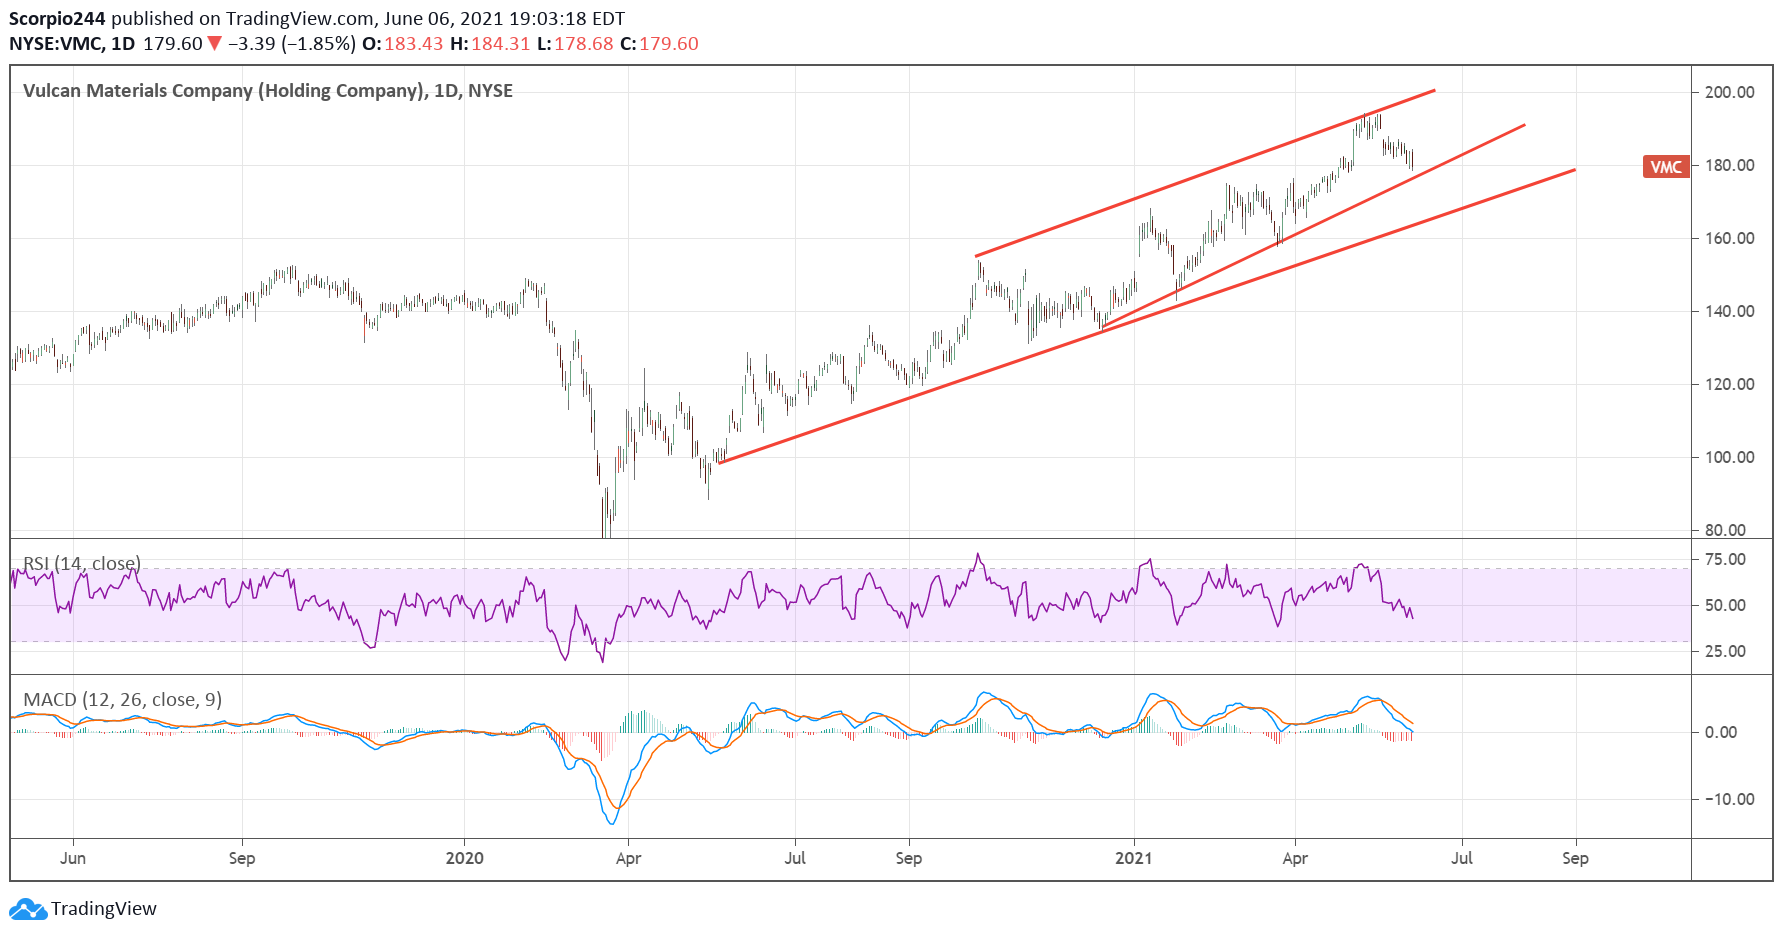
Vulcan Materials (NYSE:) have not been strong, and for now, is holding on to its trading channel. But again, the RSI and MACD are not favorable to this stock rising and show serious cracks forming in the way of bearish divergences.
Perhaps the recent weakness in the Transport and Housing Index is temporary, and they will bounce back sharply. Based on the underlying stocks in each of these indexes, it is likely not the case, as they all seem to be on the cusp of serious breakdowns, and that will not bode well for the balance of the equity market over time. It doesn’t mean everything has to break this week; it just means you need to stay alert. It is just another sign that we are moving closer to what I have been writing about in the fundamental and tactical updates: the market is moving towards multiple compression as growth in 2022 begins to decelerate and inflation expectations begin to sink.


