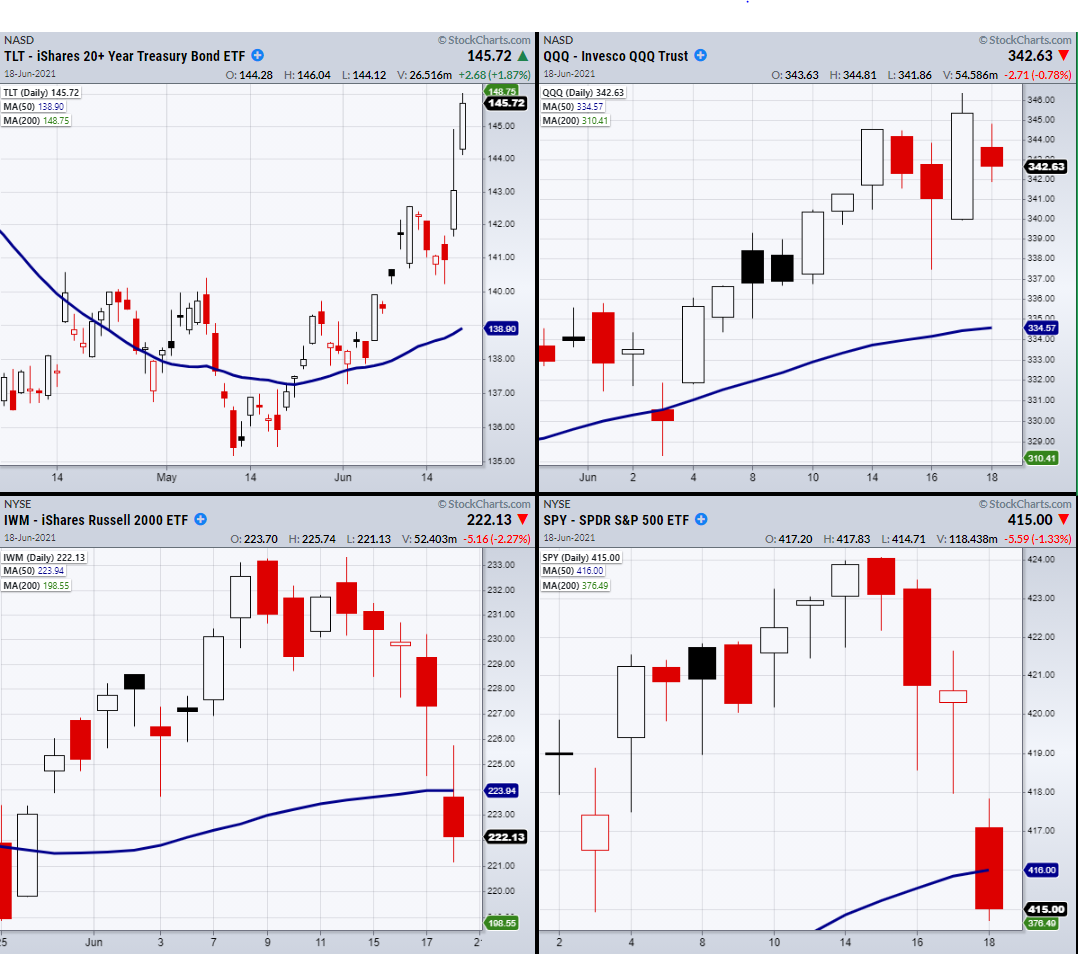
After Wednesday’s Fed , the stock market has been sitting in an uneasy state.

The U.S dollar—Invesco DB US Dollar Index Bullish Fund (NYSE:) not only firmed, but pushed over resistance from its 200-Day moving average at 24.69, confirming an accumulation phase.
Additionally, the iShares 20+ Year Treasury Bond ETF (NASDAQ:) ran up along with , creating worry among investors that the market is slowing in pace.
However, the Invesco QQQ Trust (NASDAQ:) made an inside day chart pattern which was a consolidative/pivotal chart pattern.
Meanwhile, the other major indices including the SPDR® Dow Jones Industrial Average ETF Trust (NYSE:), iShares Russell 2000 ETF (NYSE:), and the SPDR® S&P 500 (NYSE:) sold off through the day on Friday.
Of the 4 indices, only the QQQ was holding a bullish phase over its 50-Day moving average.
Come Monday, if SPY and IWM have a second close under their 50-DMA they will confirm a cautionary phase change.
This shows a potential weakness if only the tech-heavy index QQQ holds when the rest of the indices are break lower. Furthermore, the economy could also be shifting into something Mish has been talking about for a long time now. Stagflation.
Stagflation refers to an economy that is experiencing a simultaneous increase in inflation and stagnation of economic output.
For now, we will plan to continue watching the QQQs for a further divergence from the other indices, as well as the commodities, such as, precious metals and Food, which are potential hedges against an inflationary period.
ETF Summary
- S&P 500 (SPY) Will confirm caution phase with second close under the 50-DMA at 417.33.
- Russell 2000 (IWM) Broke the 50-DMA at 224.23.
- Dow (DIA) Without near support DIA needs to hold and get back over 335.20.
- NASDAQ (QQQ) 342.80 pivotal area.
- (Regional Banks) 63.38 next support area.
- (Semiconductors) 244.94 the 50-DMA.
- (Transportation) Needs to find support.
- (Biotechnology) 154 support.
- (Retail) Watching for second close under the 50-DMA at 91.80.
- Volatility Index () Held over the 10-DMA. 36.18 next resistance level.
- Junk Bonds () 108.94 support.
- (Utilities) 63.15 support.
- (Silver) 23.93 pivotal.
- (Small Cap Growth ETF) 278.27 needs to hold.
- (US Gas Fund) Sitting in pivotal support area.
- (iShares 20+ Year Treasuries) 34.68 pivotal.
- (Dollar) Confirmed accumulation phase with second close over 91.51 the 200-DMA.
- (Lithium) 66.17 support.
- (Oil and Gas Exploration) Needs to hold 90.51 area.
- (Agriculture) Inside day.
- (Gold Trust) Watching for bottoming patterns.
Fusion Media or anyone involved with Fusion Media will not accept any liability for loss or damage as a result of reliance on the information including data, quotes, charts and buy/sell signals contained within this website. Please be fully informed regarding the risks and costs associated with trading the financial markets, it is one of the riskiest investment forms possible.

