In my last article from almost two months ago, I showed using detailed Elliott Wave Principle (EWP) analysis, stating:
“If the recent September and October lows hold, I prefer to look higher for AAPL to $144-151.”
Since it has been a while, let me first assess how that forecast panned out to see if it had any merit. If it had, then I can continue to use it. If not, I will have to adjust my analysis: anticipate, monitor, and adjust if necessary.
1) I correctly labeled the Nov. 9 high as (grey) minute wave-i, but minute wave-ii did not bottom on November 10, 2020, at $114.13. Instead, it morphed into a -complex- irregular flat bottoming on Nov. 24, at $112.59. Less than 1.5% below Nov. 10 low. This marginal lower low only slightly adjusted the (grey) minute wave-iii, iv, and v targets.
2) On Nov. 11, I anticipated a top for minute wave-iii around $138.45. Apple (NASDAQ:AAPL) got to $138.79
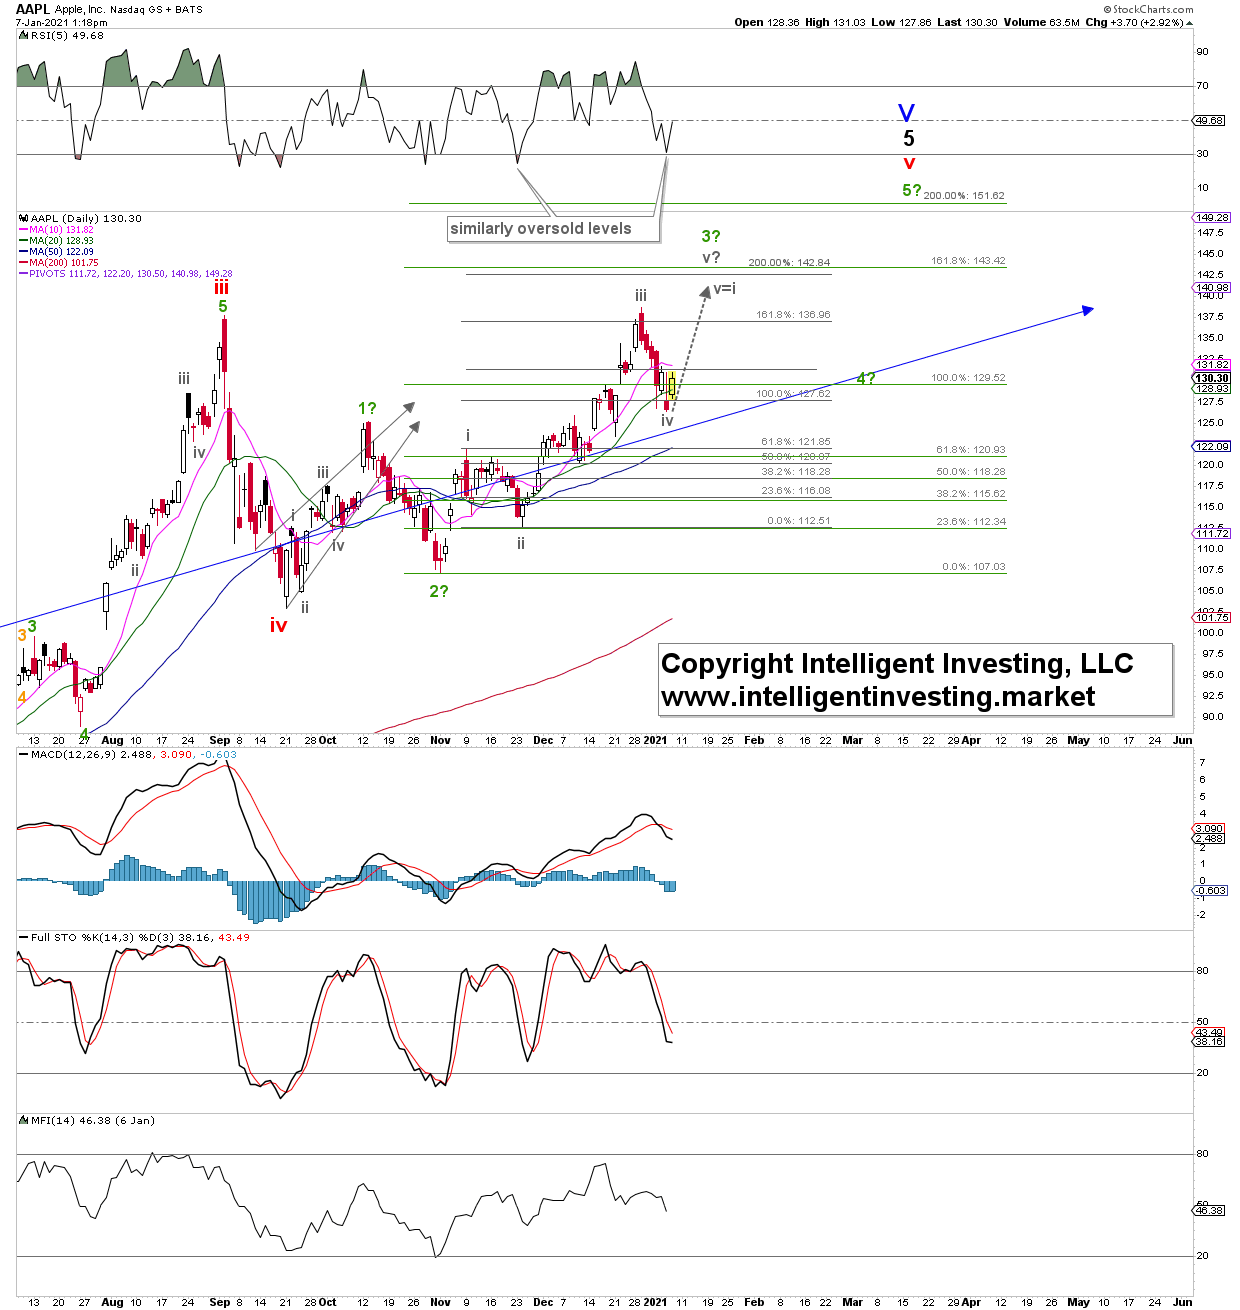
and, 3) corrected to yesterday’s low for what I have labeled as a (grey) minute wave-iv. Thus, my November forecast was only off by 1.3% ($129.05 vs. $126.28) for this low. If this low holds, then minute wave-v is now underway to ideally $142-143 to complete the one-degree high (green) minor-3 wave. Note how the 200% and 161.80% extensions coincide and the v=i (wave-v equals the length of wave-i) arrow. The first is a typical wave-v extension target, the second a regular 3rd wave Fib-extension target, and the 3rd a classic relationship between 5th and 1st waves.
AAPL daily candlestick chart with technical indicators and preferred Elliott Wave count:
 Apple Daily Candlestick Chart With Technical Indicators.
Thus, AAPL has so far adhered almost picture-perfect to the ideal/text-book Fibonacci-based EWP count for (grey) minute waves-ii, iii, iv. Therefore, it is only logical to assume minute wave-v will continue to do the same: adhere to the text-book Fibonacci-based EWP count and target $142-143. From there, minor-4 and -5 will still need to develop, targeting ideally $129.50 and $151.60, respectively. Of course, any of the remaining up waves (minute-v and minor-5) can extend, i.e., become more protracted than what is “standard,” but I cannot know that beforehand. We’ll deal with that when it happens.
Bottom line: Almost two months ago, the EWP helped me forecast AAPL’s recent highs and lows almost to the tee, showing this method can be a very accurate and powerful tool in forecasting tops and bottoms in stocks (and other assets) long before they happen. Thus, if yesterday’s low holds, I continue to expect AAPL to adhere to the Fibonacci-based EWP count and reach the low $150s before a much larger correction ensues.
Leave a comment