Today, we are going to examine the stock of another European company. Intertek is a leading total quality assurance provider. Basically, other companies pay Intertek to test and guarantee the quality of their products and services. The company traces its roots back to 1888 and went public in 2002. It trades on the London Stock Exchange under the ticker ITRK.
The fact that Intertek is over 130 years old is not a coincidence. With the exception of the crisis-hit 2020, the company is profitable, growing and not overburdened with debt. So its fundamentals are not the place to look for cracks in the bullish thesis. At a P/E ratio of 35, the problem is valuation.
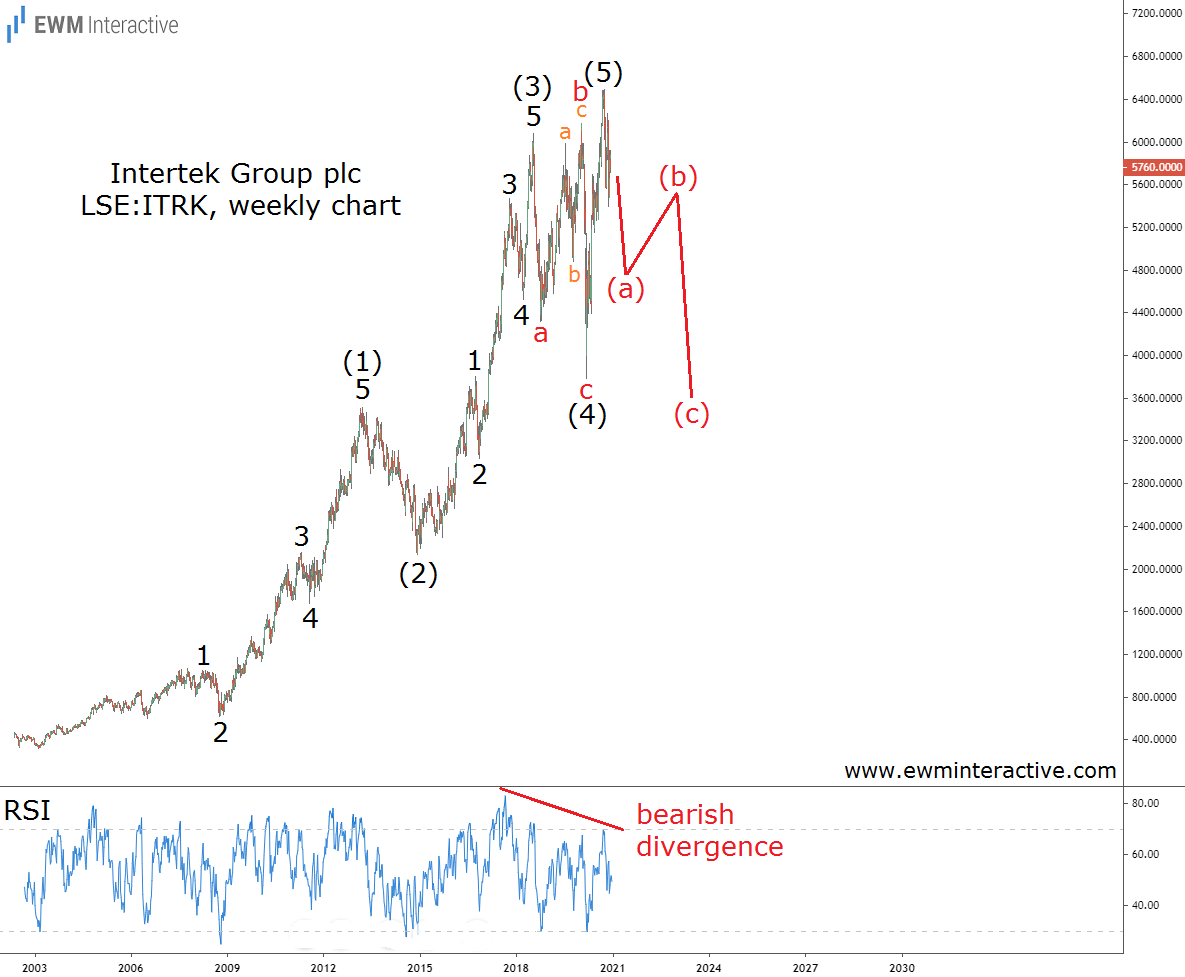
 Intertek Group Inc Weekly Chart
Valuations, however, can remain stretched for quite a while, especially in a zero-rate world. The Elliott Wave chart above, on the other hand, makes things much more specific. It reveals that a clear five-wave impulse has been in progress since 2003. The pattern is labeled (1)-(2)-(3)-(4)-(5) and five sub-waves of (1) and (3) are also visible.
Intertek ‘s Elliott Wave Structure Puts its Valuation into Context
In addition, the guideline of alternation is also on display here. Wave (2) was a sharp decline, while wave (4) looks like an expanding flat correction. Wave ‘c’ of (4) unfolded during this year’s coronavirus selloff. If this count is correct, the post-March surge to a new record must be wave (5).
Unfortunately for the bulls, the theory states that a three-wave correction follows every impulse. The negative phase of the cycle usually erases the entire fifth wave. In Intertek ‘s case, this means a drop to roughly 3800 pence a share can be expected. The bearish RSI divergence between waves (3) and (5) supports the negative outlook. In our opinion, 5760 pence is a risky price to pay for ITRK stock right now.
Leave a comment