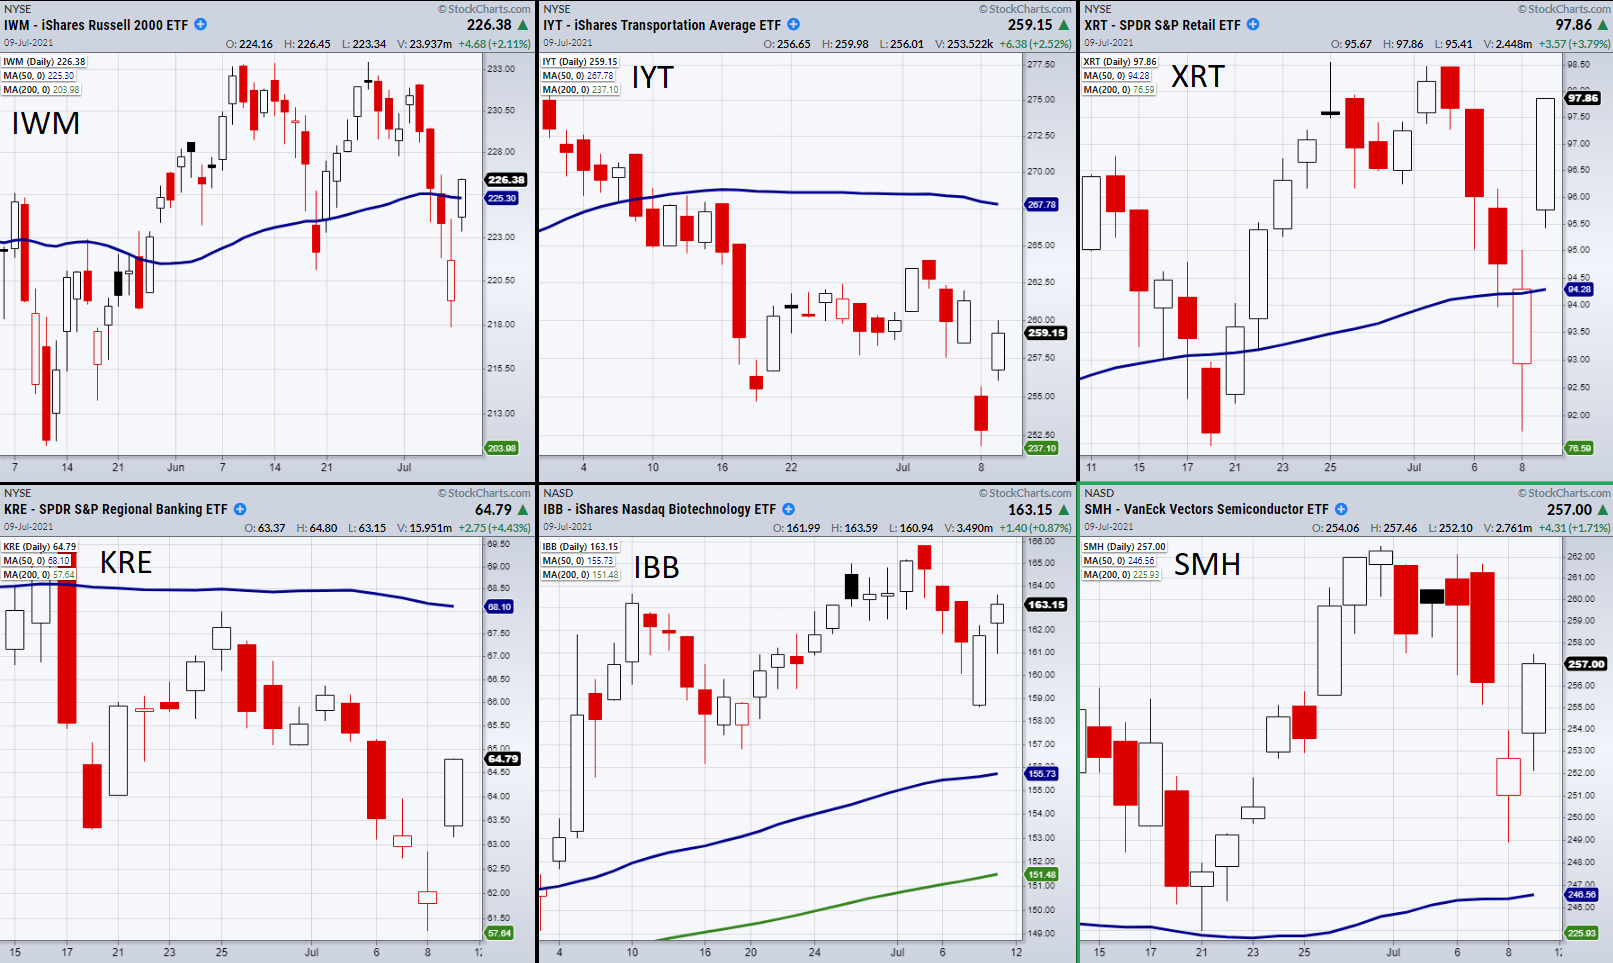
Friday the Economic Modern Family, which consists of 5 sectors and 1 major Index, made a quick turnaround in the small-cap index () and the retail space ().

Both closed over their 50-Day major moving average and are now in unconfirmed bullish phases as seen in the above chart.
This shows that the Family is attempting to jump back into a mostly bullish phase. However, the increased volatility could also be showing that the current market situation is choppy.
With that said, we need to be careful not to get whipsawed when trading. Getting whipsawed refers to price movement that rapidly shifts direction. To avoid this, we can use the Economic Family to time our trade entries.
A large benefit of using the Family is its ability to give a quick snapshot of the overall market without overcomplicating or adding too much data to the pot.
The adage ‘less is more’ fits this situation quite well.
With that said, IWM and XRT’s recent flip into a bullish phase means we can watch them for potential breakouts to new highs.
However, because IWM has been rangebound and has a large amount of resistance at $234, we should be careful when entering trades near this price level.
This will help prevent getting whipsawed if prices begin to reverse.
When it comes to other Economic Family members, we can watch for bullish phases to stay intact and for and , which are currently in cautionary phases, to hold recent lows made from last Thursday on July 8.
ETF Summary
- () New highs.
- (IWM) Watching for a second close over the 50-DMA at 225.49.
- () If it holds 348, next resistance is at 351.09.
- () Holding near highs.
- KRE (Regional Banks) Sitting under 64.94 the 10-DMA.
- (Semiconductors) 245 main support area. 262.50 resistance.
- IYT (Transportation) 251.78 new support.
- (Biotechnology) 159 support area. 165.79 resistance.
- XRT (Retail) 99.24 main resistance.
- Junk Bonds () 109.57 support.
- (Utilities) Needs to get back over 64.50 area.
- () Needs more consolidation and to hold the 200-DMA.
- (Small Cap Growth ETF) 293 resistance.
- (iShares 20+ Year Treasuries) 140 support. 148.30 resistance.
- USD () 91.40 next support area.
- (Agriculture) 17.54 support.
- (Trust) Inside day.
- () 12.30 support. 13.31 minor resistance.
- (Solar Energy) 86.71 support. With 81 main support.
- (US Fund) Cleared back over the 10-DMA at 49.96.
- (S&P Metals and Mining) Needs a phase change over the 50-DMA at 44.52.
Fusion Media or anyone involved with Fusion Media will not accept any liability for loss or damage as a result of reliance on the information including data, quotes, charts and buy/sell signals contained within this website. Please be fully informed regarding the risks and costs associated with trading the financial markets, it is one of the riskiest investment forms possible.

