
Facebook (NASDAQ: NASDAQ:FB) has been trading in a consolidative manner recently, staying between the 264.00 and 280.00 barriers. The picture remains trendless on a broader scale as well, as the stock has been oscillating within a symmetrical triangle pattern since it hit its record high of 304.75 on August 26th. Thus, with all that in mind, we will adopt a neutral stance with regards to this stock’s outlook.
In our view, the picture will get brighter only if we see a decisive close above 297.00, which is the high of November 5th. This will also signal the upside exit out of the aforementioned triangle and may initially aim for the stock’s record high of 304.75. If investors are not willing to give up near that price again, a break higher may pave the way towards the 161.8% Fibonacci extension level of the triangle’s width, which is at around 340.00.
Looking at our short-term oscillators, we see that the RSI points east, sitting fractionally above its equilibrium line. The MACD is flat as well, lying near both its zero and trigger lines. Both indicators suggest a lack of directional price momentum, which enhances our choice to stay sidelined until the stock exits the triangle pattern.
In order to start examining the bearish case, we would like to see a dip below the lower bound of the triangle, as well as below the 264.00 zone which provided decent support on November 10th and 23rd. Such a dip may set the stage for declines towards the 247.00 area, the break of which could see scope for extensions towards the low of July 24th, at 227.00.
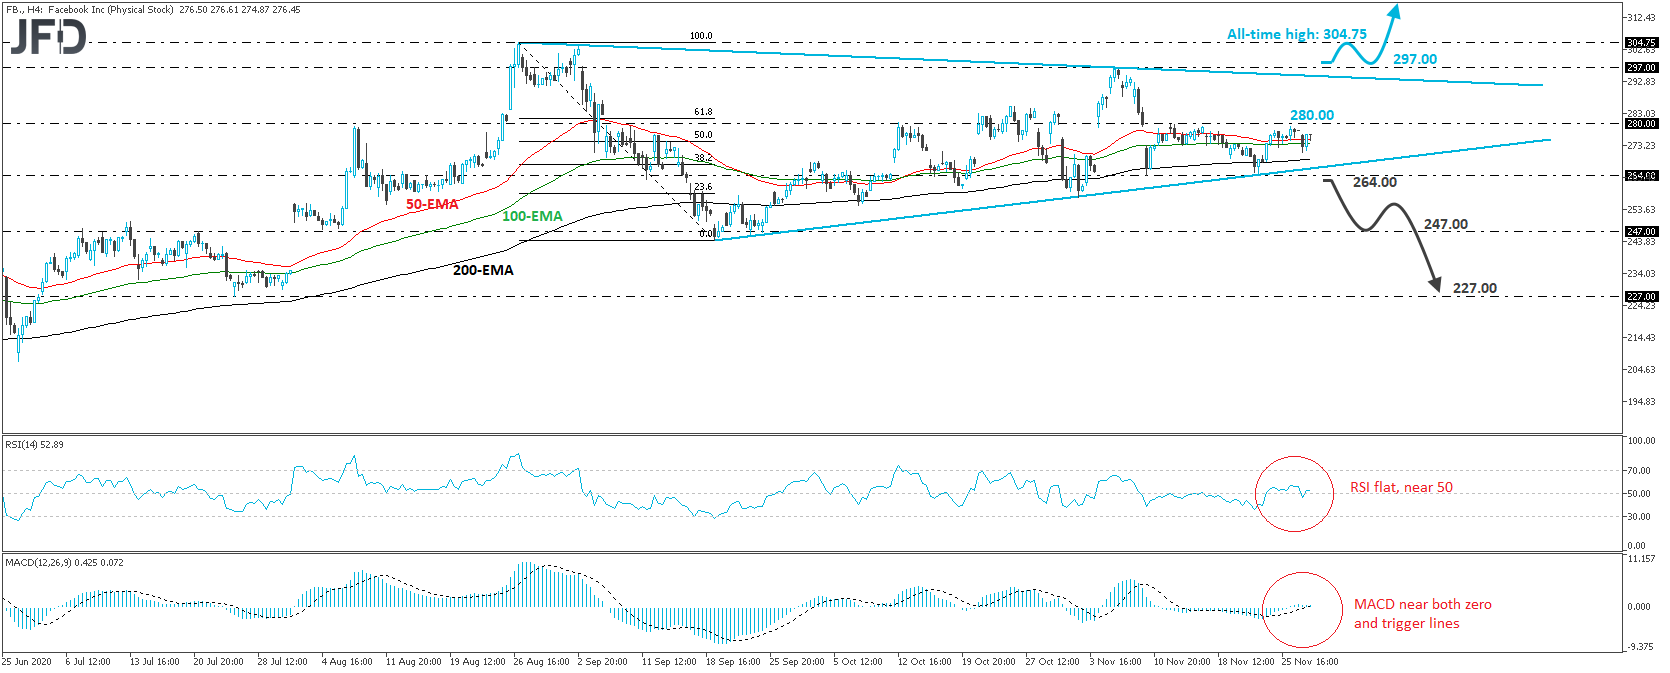 Facebook 4-hour chart technical analysisOriginal Article