Like most technology firms, Experian (OTC:EXPGF) adapted to the new work-from-home environment relatively quickly. The Irish data and analytics company even managed to grow its revenue in 2020, even though its EPS didn’t change much from 2019.
After the initial coronavirus selloff in March, the stock swiftly recovered, as well. EXPN.L is currently hovering around 2900 pence a share, not too far below its November all-time high of 3192. Given Experian’s margins and cash-generating abilities, the company’ long-term future looks bright. In the mid-term, however, the stock appears vulnerable.
 Experian Stock Weekly Chart
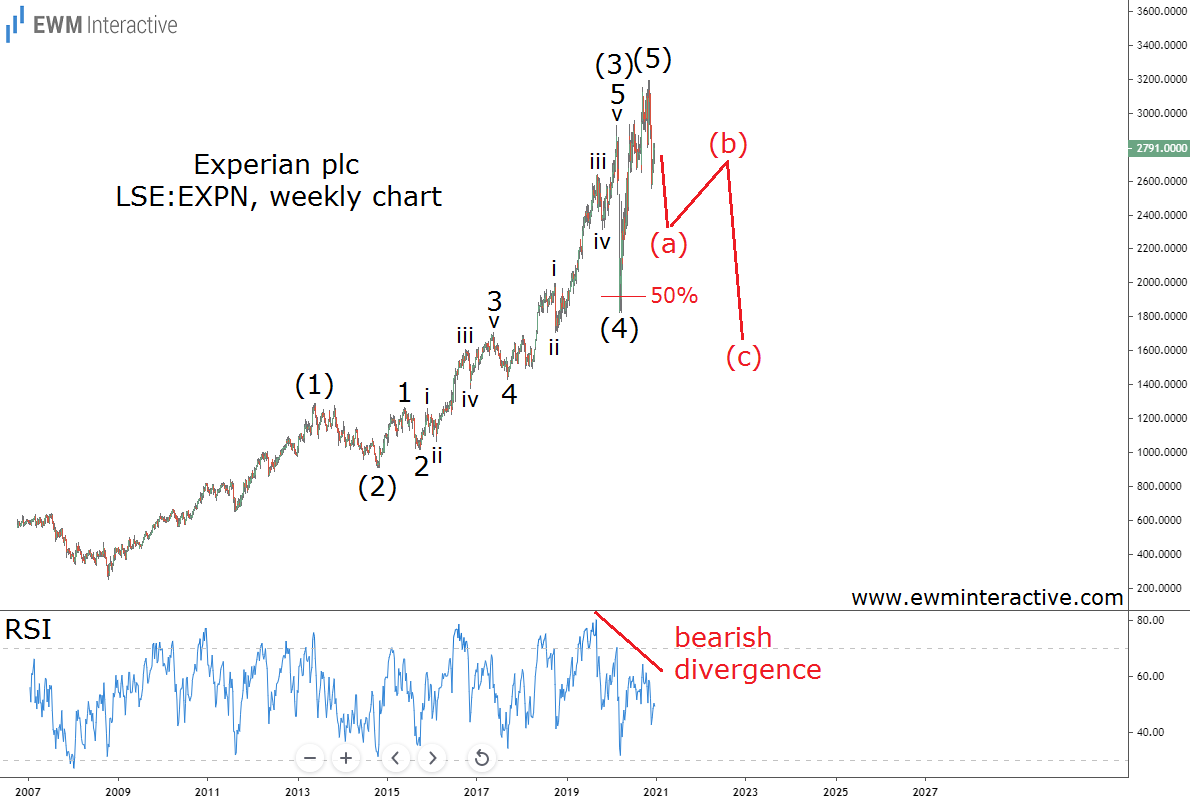
Experian ‘s P/E ratio of 38 suggests it’s overvalued to begin with, but the Elliott Wave chart above makes the danger much more imminent. It reveals that a clear five-wave impulse has been in progress since the October 2008 bottom.
Elliott Wave Analysis Makes Experian ‘s Valuation Problem Obvious
The pattern, which managed to lift the price by 1177% over the following 12 years, is labeled (1)-(2)-(3)-(4)-(5). The impulsive structure of wave (3) is also visible. Wave 5 is the extended one, which explains why wave (4) retraced over 50% of (3), instead of the usual 38.2% Fibonacci.
If this count is correct, the recovery from 1823 to 3192 fits in the position of the final wave (5). ‘Final’, because according to the theory, every impulse is followed by a three-wave correction in the opposite direction. Besides, the RSI indicator shows a strong bearish divergence between waves (3) and (5).
The analysis so far makes us think this is not a good time to join the bulls in Experian. After a complete impulse pattern, the bears are often aiming at the support of the fourth wave. Here, this means a decline to roughly 1800 pence a share can be expected. The stock can lose ~35% in the next year or two.
Leave a comment