S&P 500 earnings update
The earnings per share (EPS) increased to $191.52 this week. This is the 10th straight week the EPS has increased, and 21 out of the 22 weeks so far this year.
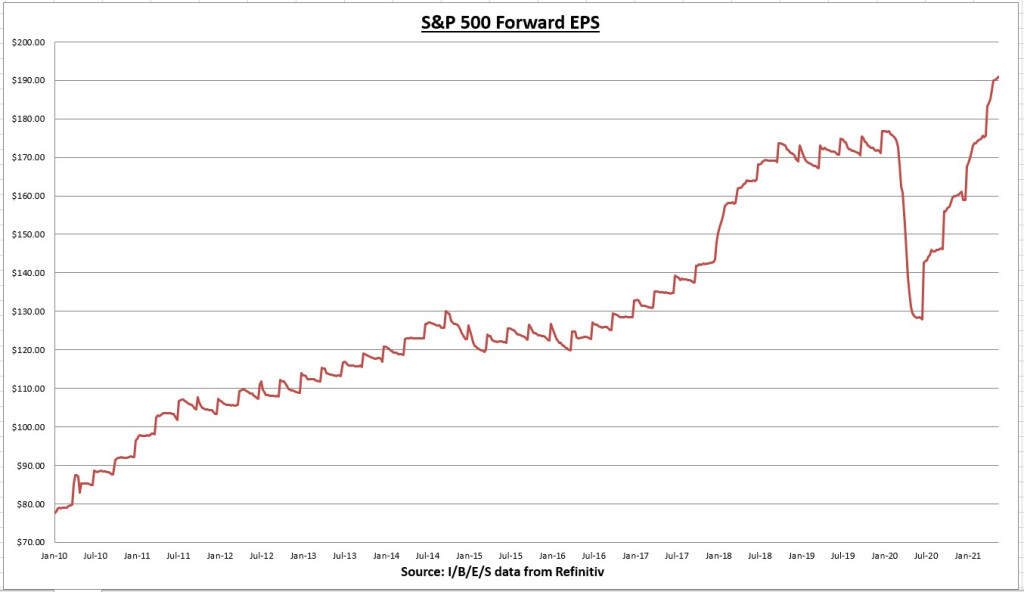
Q1 earnings have largely wrapped up, with 99% of the index now reported. 87% of companies have beaten estimates, and combined earnings have come in 22% above expectations. (I/B/E/S data from Refinitiv)
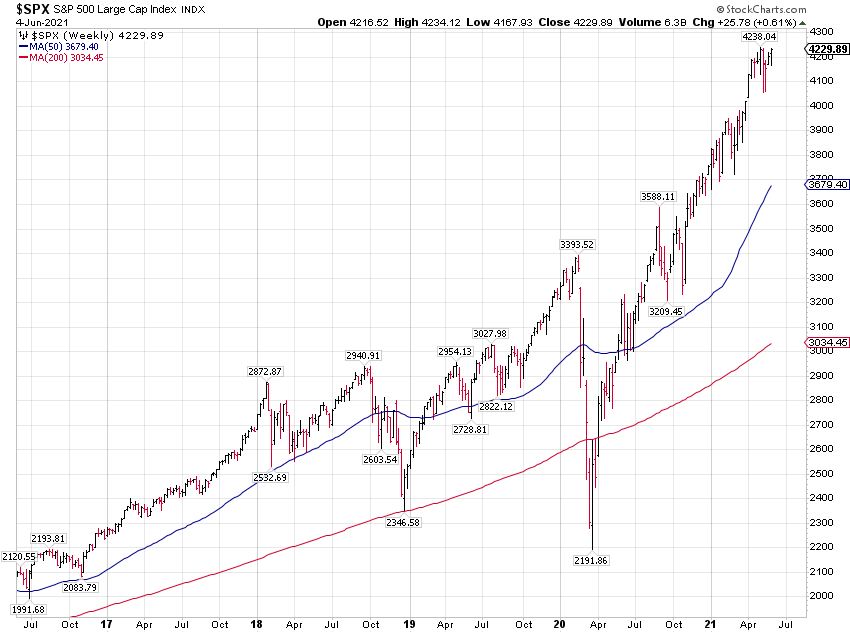
The S&P 500 increased 0.61% this week, closing just shy from another record.
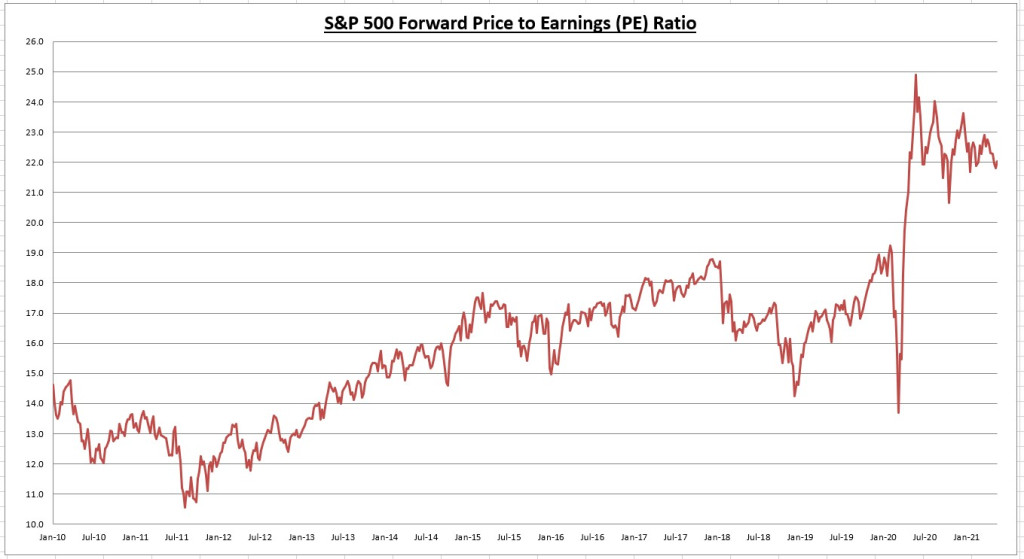
The S&P 500 price to earnings (PE) ratio is now 22.1.
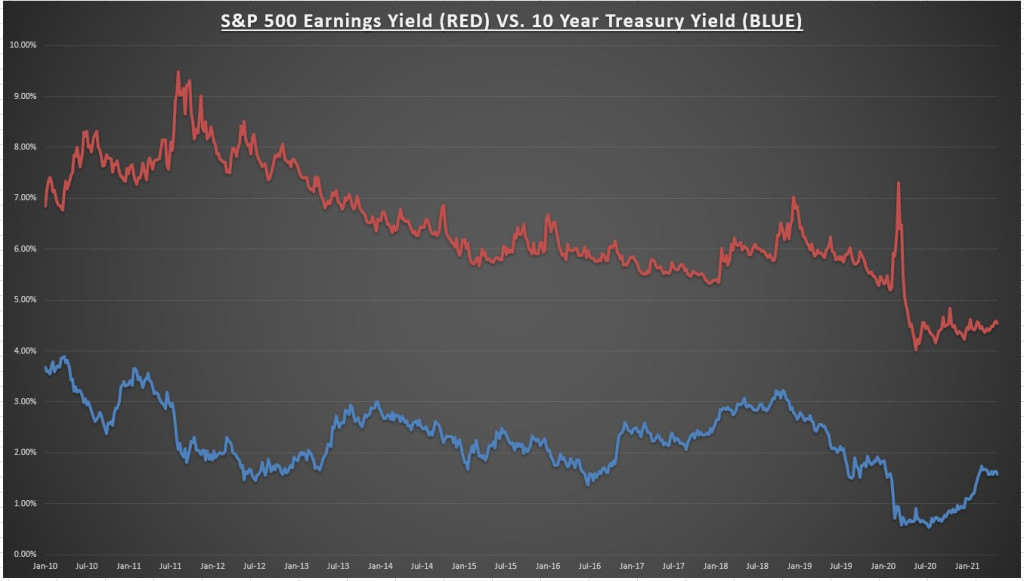
The S&P 500 earnings yield is now 4.53%, which is still reasonably priced in relation to fixed income alternatives, as the treasury bond rate fell to 1.56%.
Economic data review
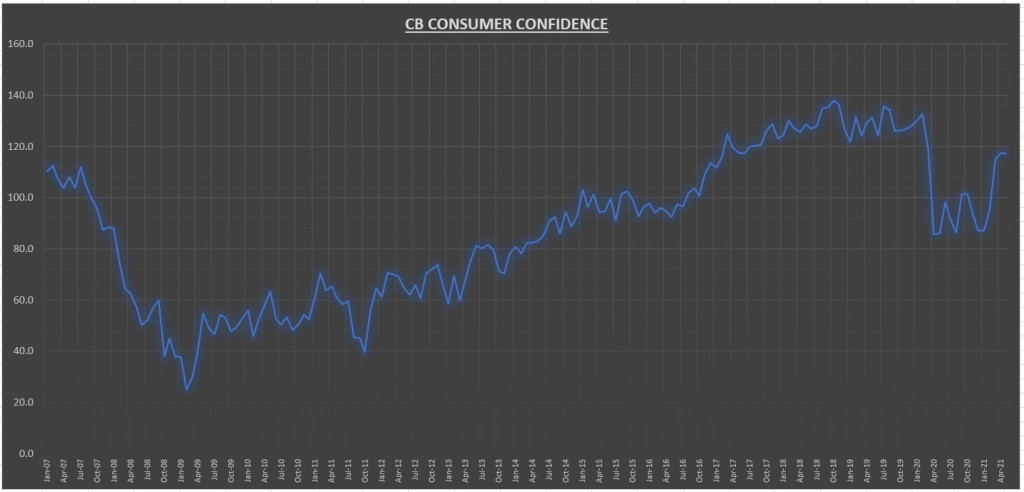
came in at 117.2 for May, -0.3% below last month (which was revised down from 121.7 to 117.5), and +36.4% higher than a year ago. February and March results were both revised higher by +5.3% and +5.4% respectively.
“Consumers’ assessment of present-day conditions improved, suggesting economic growth remains robust in Q2. However, consumers’ short-term optimism retreated, prompted by expectations of decelerating growth and softening labor market conditions in the months ahead. Consumers were also less upbeat this month about their income prospects—a reflection, perhaps, of both rising inflation expectations and a waning of further government support until expanded Child Tax Credit payments begin reaching parents in July. Overall, consumers remain optimistic, and confidence should remain resilient in the short term, as vaccination rates climb, COVID-19 cases decline further, and the economy fully reopens.”
Consumers expectations index declined 8.2% for the month. The percentage of consumers expecting business conditions to improve over the next six months declined 8.5%, while the percentage of consumers expecting business conditions to worsen over the next six months increased 22.3%.
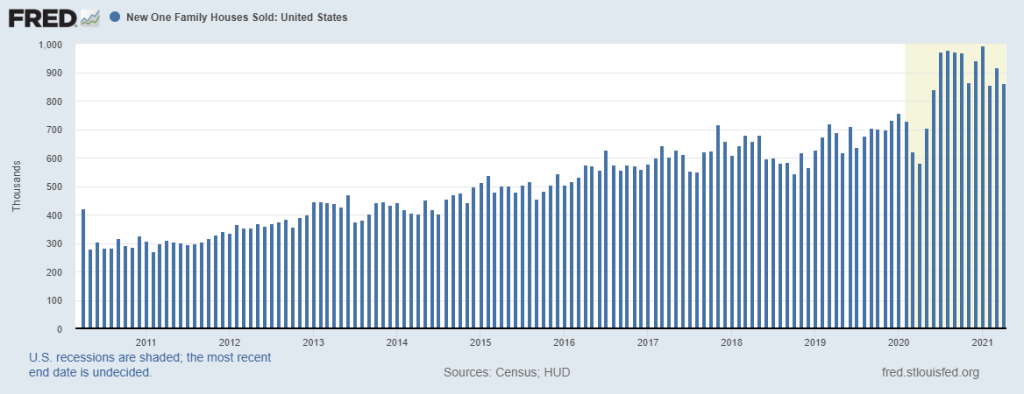
for April came in at 863K, which is 5.9% below the prior month (which was revised down from 1021K to 917K), and 48.3% higher than a year ago.
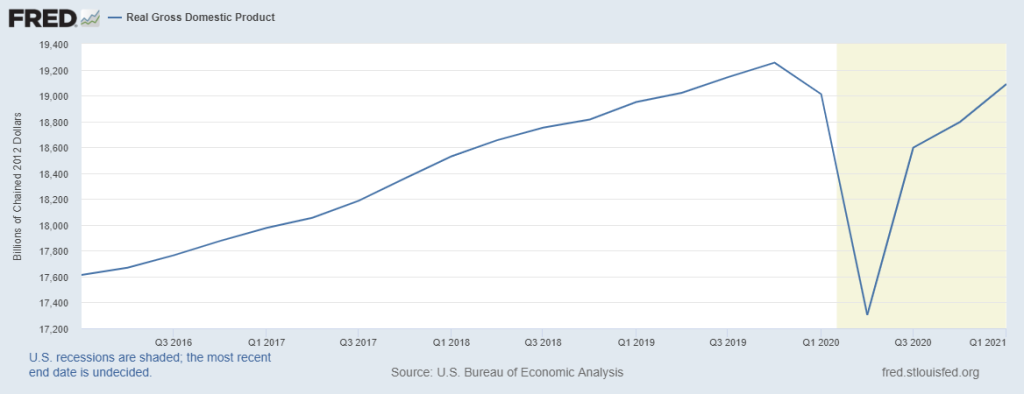
We got our second estimate of 1st quarter real Gross Domestic Profit (), which was relatively unchanged from the first estimate at +6.4% annualized. The economy has recovered 91.5% of the COVID recession in inflation adjusted dollars, and is likely to make a new all time high as early as Q2.
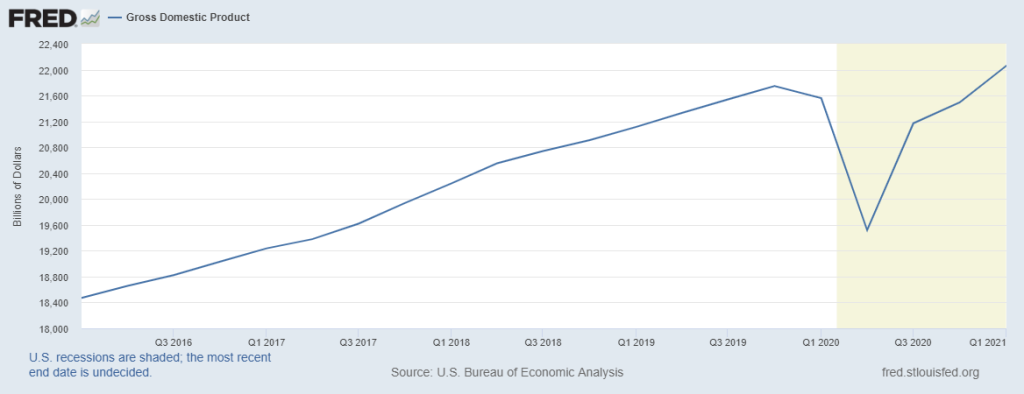
Also worth noting is the economy has already surpassed the pre COVID high point in nominal terms (unadjusted for inflation).
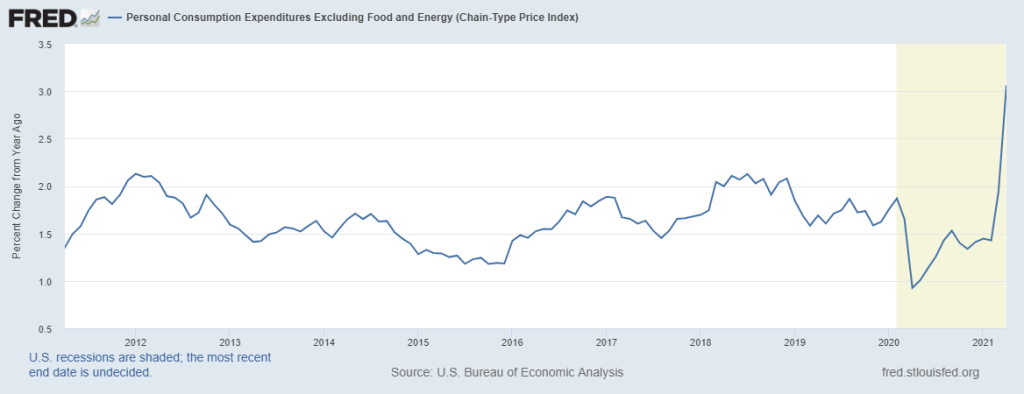
Personal Consumption Expenditures excluding volatile food & energy prices () increased 0.7% in April and +3.1% annualized (up from +1.9% annualized last month). You have to go back to February 1992 to find a higher annualized PCE inflation reading. Core PCE is the Fed’s preferred method of inflation monitoring.
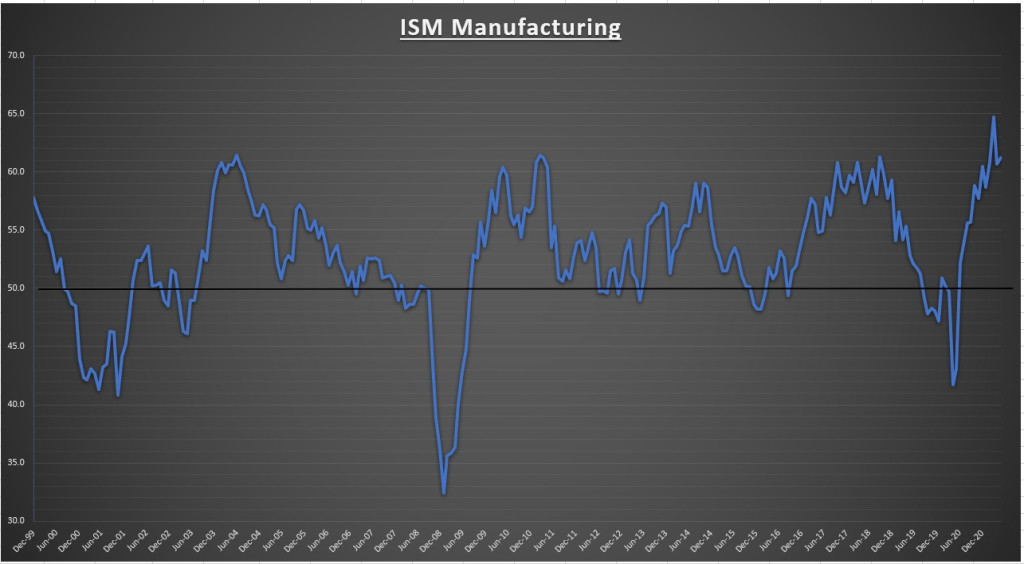
The came in at 61.2 for May, an increase of 0.5% for the month and the 12th straight month of expansion (readings above 43.1 indicate expansion). The new orders index increased 2.7% for the month, while the prices index (input costs) declined 1.6%. 16 of the 18 manufacturing industries reported growth for the month.
“The Manufacturing PMI continued to indicate strong sector expansion and U.S. economic growth in May. All five
subindexes that directly factor into the Manufacturing PMI® were in growth territory.”“Manufacturing performed well for the 12th straight month, with demand, consumption and inputs registering strong growth compared to April. Panelists companies and their supply chains continue to struggle to respond to strong demand due to the difficulty in hiring and retaining direct labor. Record backlog, customer inventories and raw material lead times are being reported. The manufacturing recovery has transitioned from first addressing demand headwinds, to now overcoming labor obstacles across the entire value chain.”
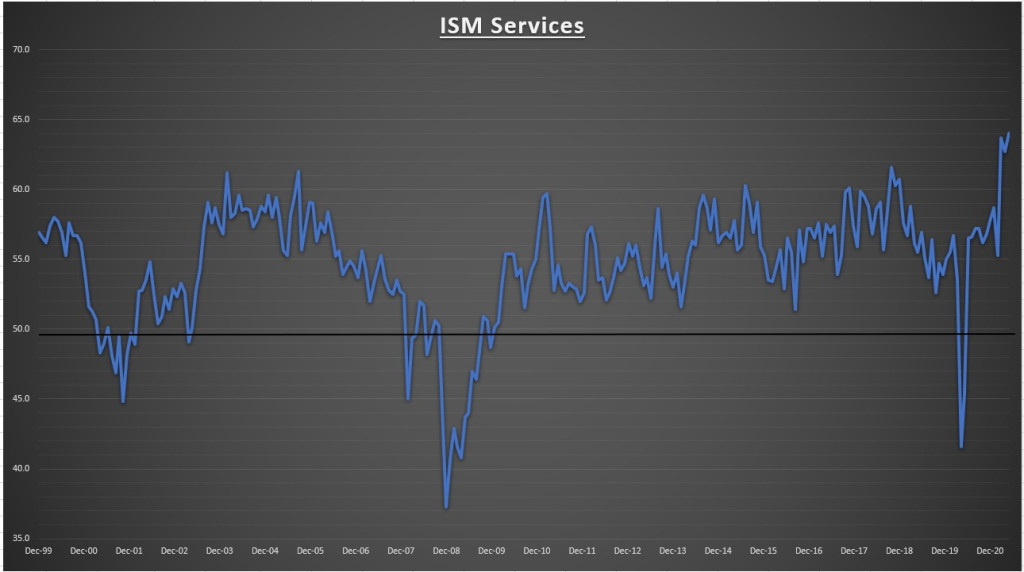
The reached another new all time high in May, coming in at 64. A gain of +1.3% over the prior month.
“According to the Services PMI, all 18 services industries reported growth. The rate of expansion is very strong, as businesses have reopened and production capacity has increased. However, some capacity constraints, material shortages, weather-related delays, and challenges in logistics and employment resources continue.”
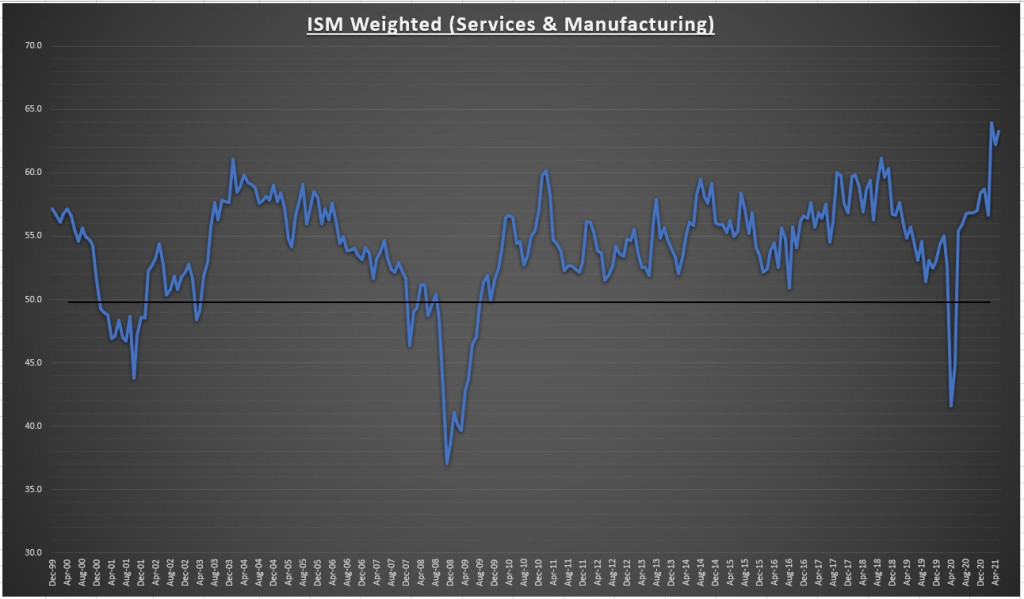
My weighted ISM (which takes into account how much the services and manufacturing sectors comprise in today’s economy) came in at 63.3 for May. At 63.3, if annualized, corresponds to an approximate GDP growth rate of 5.2%.
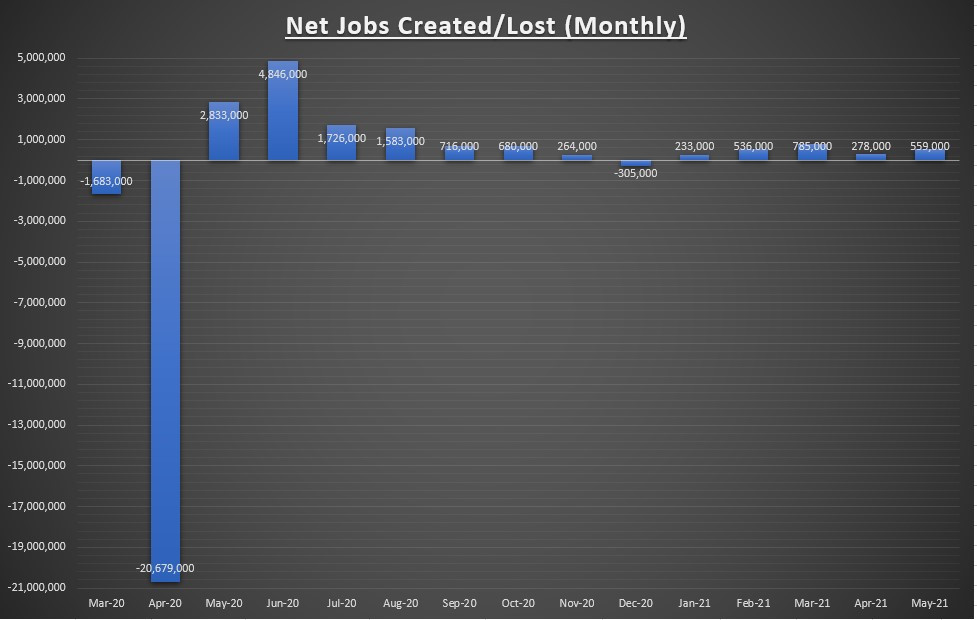
The BLS Non-farm employment report showed a net jobs gain of +559,000 in May. March and April results were both revised higher, March went from +770K to +785K, and April went from +266K to +278K, a net jobs gain of +27K higher than previously reported.
Approximately 87% of the job gains came from the private service providers, with leisure and hospitality reporting a net gain of +292K jobs.
Average weekly hours remained the same as the last month, at 34.9, and average hourly earnings increased +0.5% for the month.
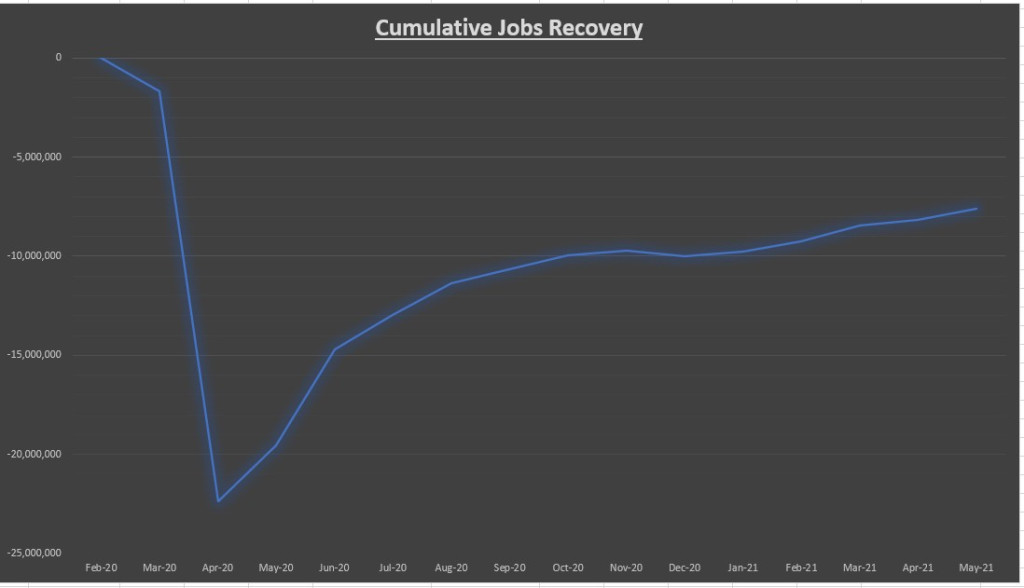
13 months into the jobs recovery and we’ve now recovered about 66% of the net job losses. Still 7.6 million below pre-COVID highs.
Notable earnings
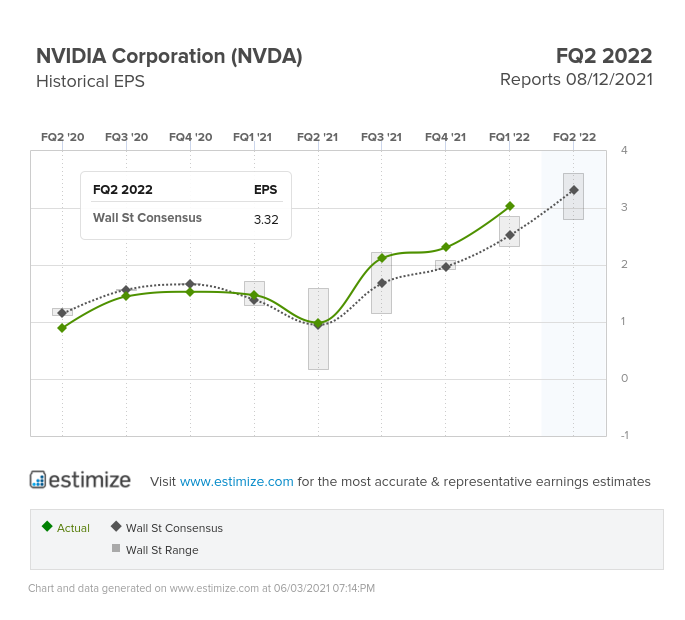
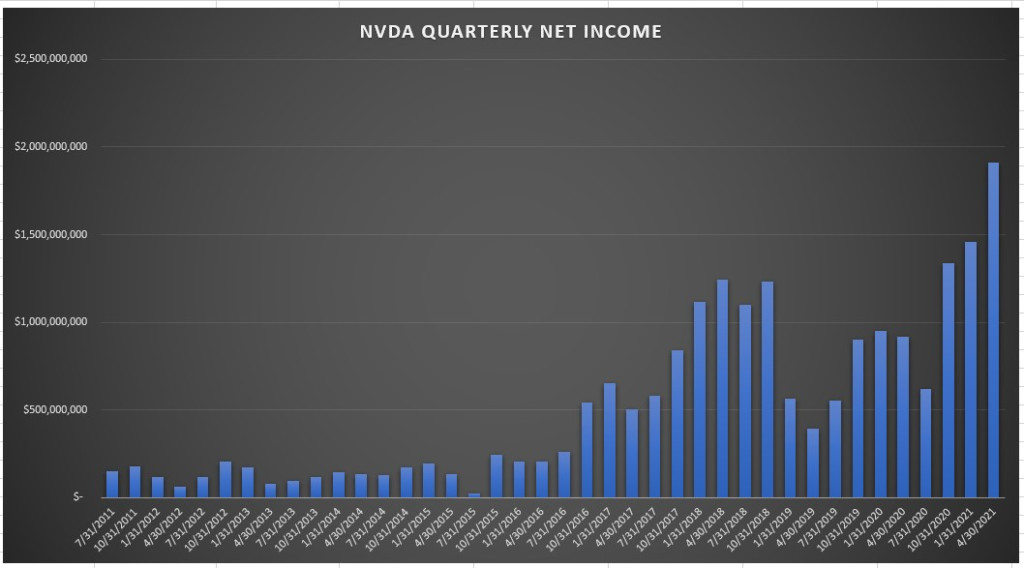
Nvidia (NASDAQ:) reported quarterly the week prior, with EPS coming in +20% above expectations for a growth rate of +106% over Q1 2020 results.
A new record high for quarterly net income for the company as operating margins improved.
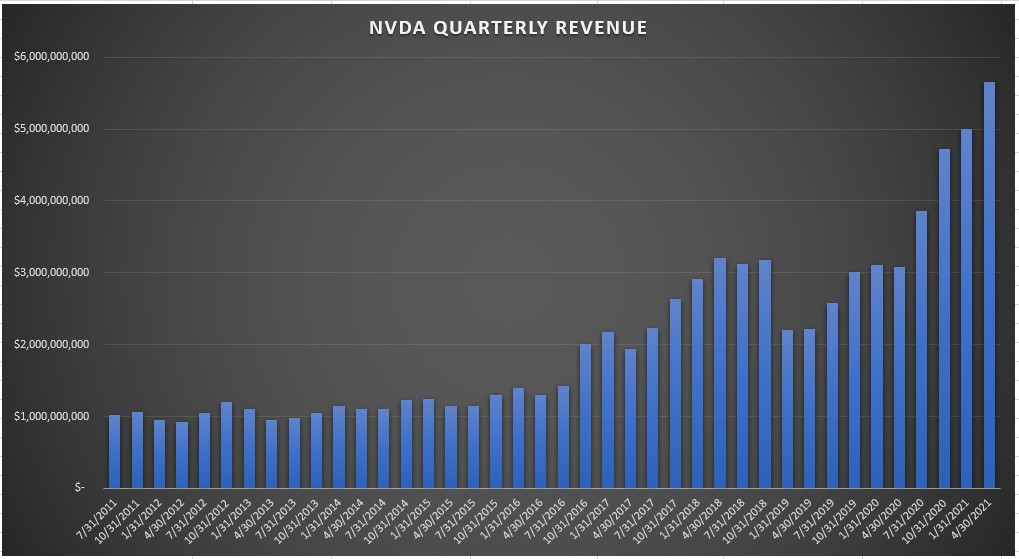
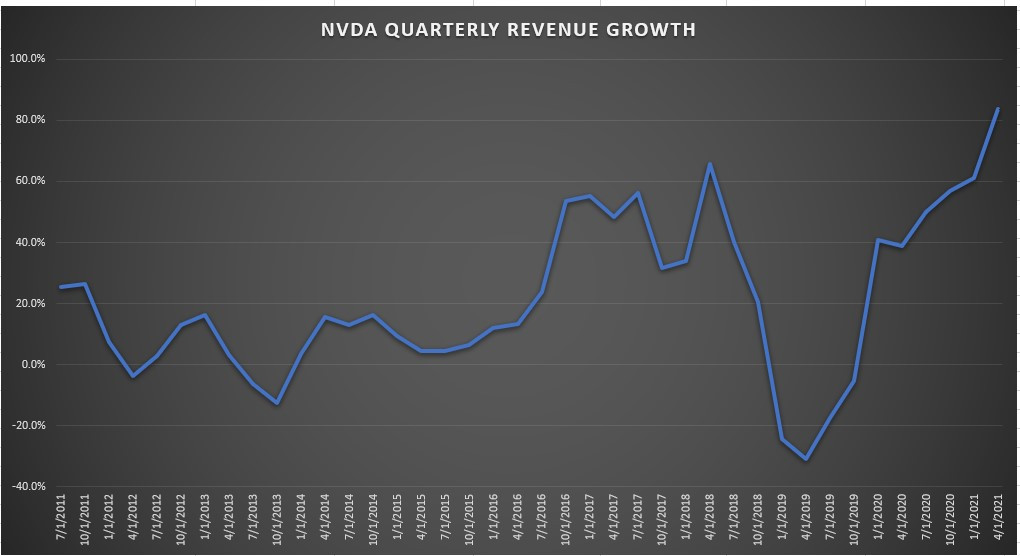
A new record high for quarterly revenues as well. Q1 revenues came in +5% above expectations, for a growth rate of 84% over Q1 2020 results.
A record high revenue growth rate as sales surged on increased demand for both gaming and data center products. The company also raised forward guidance.
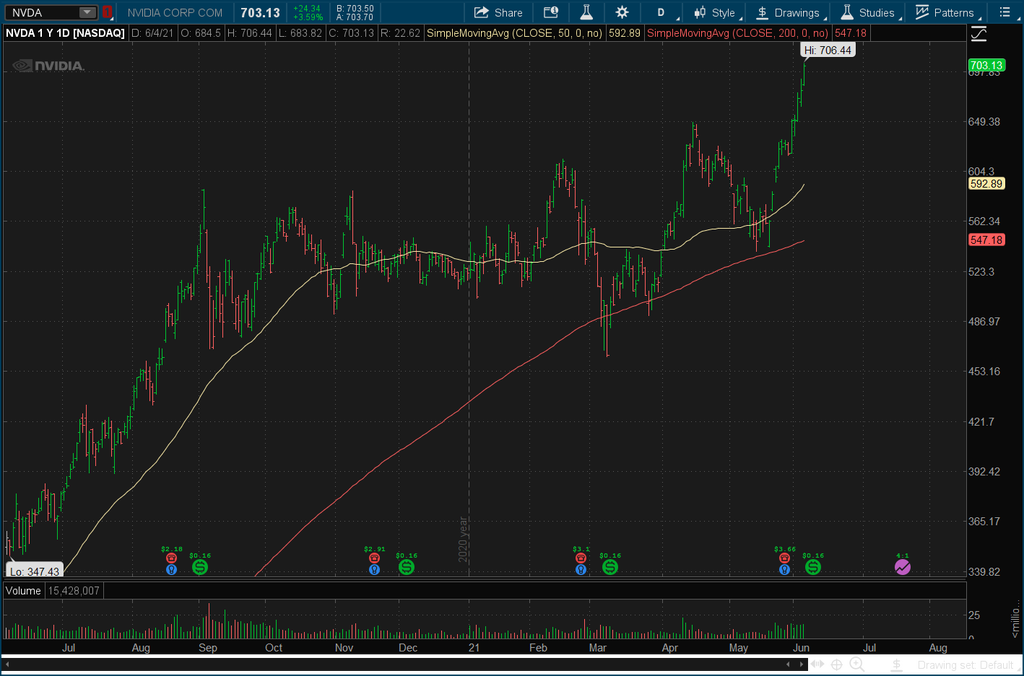
Another great company whose stock price is already priced near perfection at 21x sales and 45x forward earnings. The surge in demand due to data mining cryptocurrency could lead to volatility if the crypto trend were to reverse, like it did in 2018. The company is executing very well in all segments, and if the ARM deal goes through (roughly a 50/50 chance right now) it would only strengthen its competitive advantages.
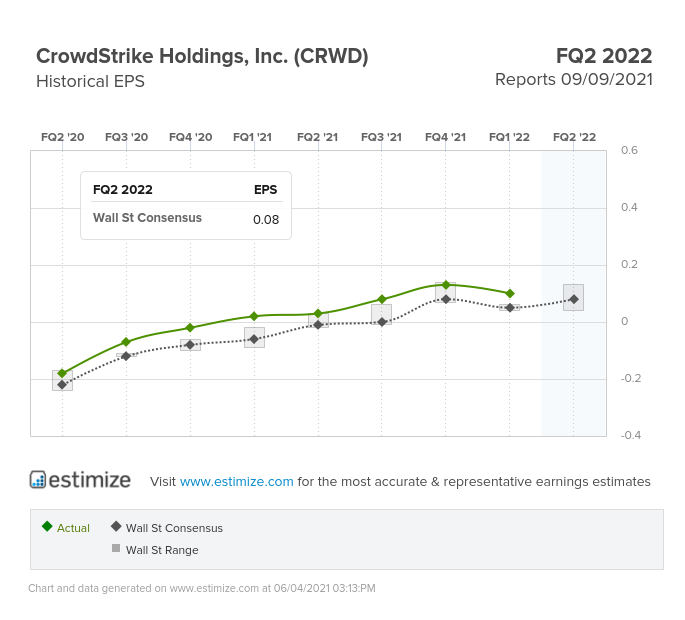
Cyber security company Crowdstrike (NASDAQ:)reported another strong , with adjusted EPS coming in 100% above expectations.
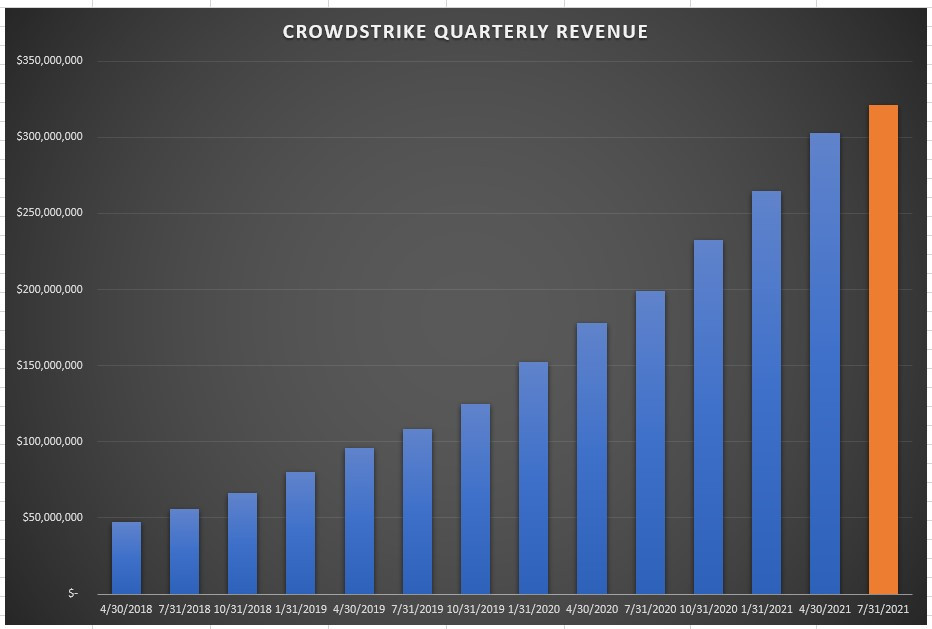
Revenues grew 70% year over year and came in about 4% above street expectations. Sequential revenue growth came in at 14%, slightly below the company’s average since IPO of 17%. The company guided for approximately 63% revenue growth (14.3% sequential growth) in the next quarter (orange bar in chart above).
Customer count grew 82%, now 11,420, with 64% of customers buying at least 4 of the company’s cloud security products.
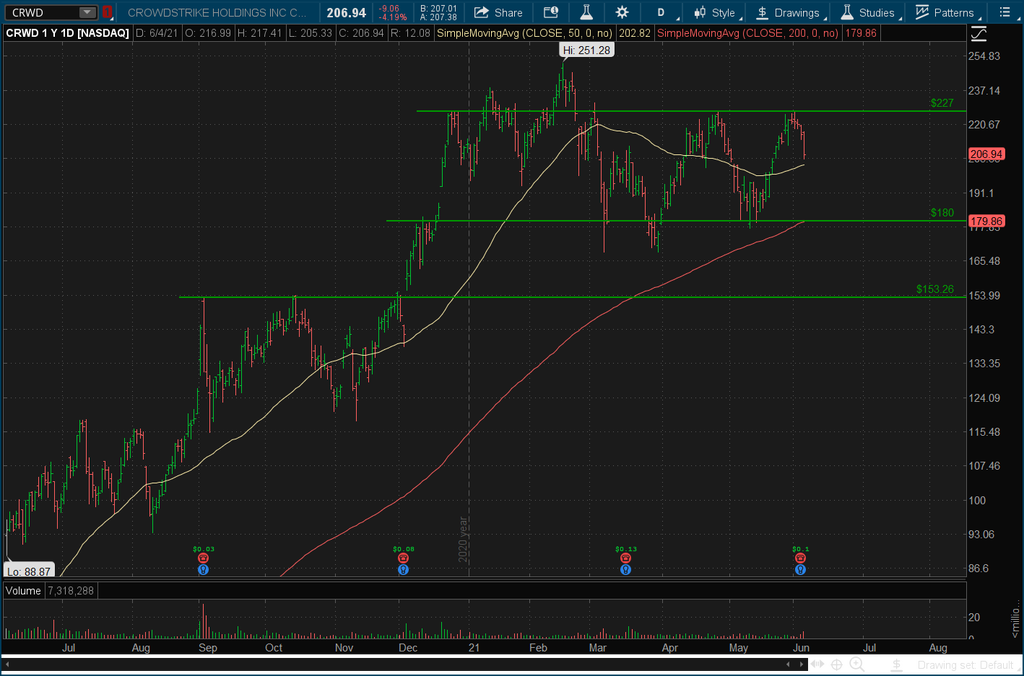
Another strong quarter for a great company whose stock price isn’t cheap. The stock has been consolidating recent gains and declined post earnings due to concerns about the slowing growth rate and rising operating costs. Crowdstrike, Zscaler (NASDAQ:), and Fortinet (NASDAQ:) are top of class in a very important industry. Doesn’t mean they will turn out to be tremendous stock performers but I like a lot of what the company is doing and believe it has a place in a well diversified portfolio. (Disclosure: Own all three cyber security companies)
Chart of the week
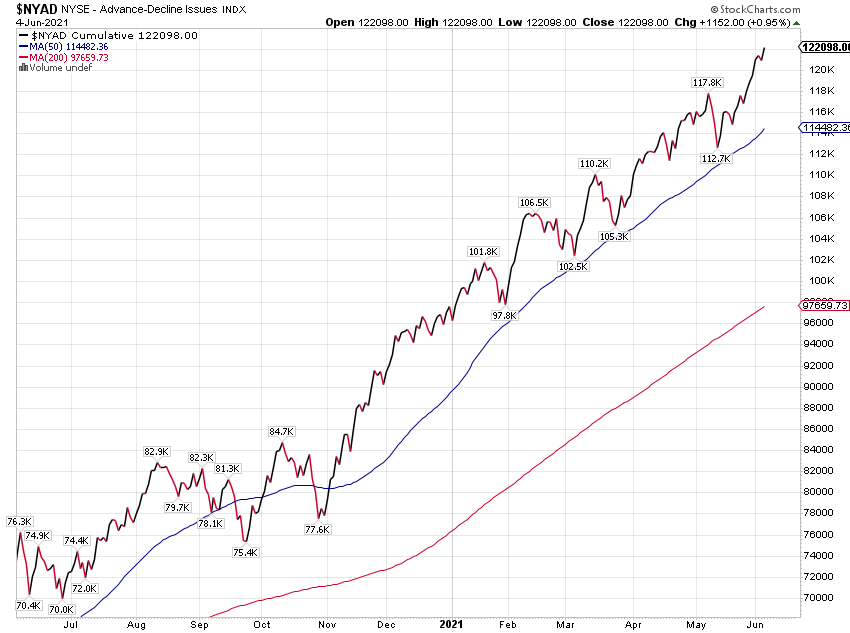
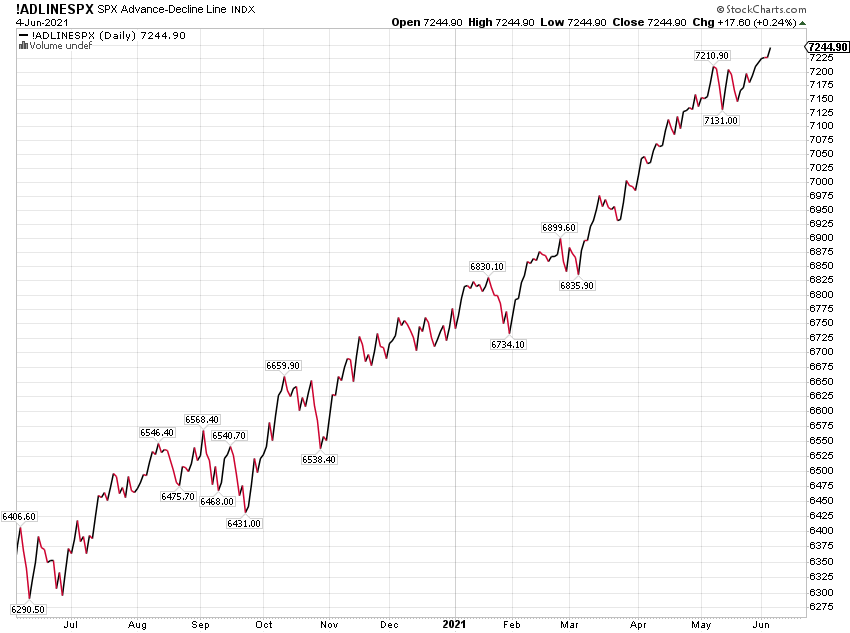
This weeks charts are the cumulative advance-decline lines for the and the S&P 500 index. It takes the number of stocks that close higher and subtract the stocks that close lower on a daily cumulative basis. My favorite technical indicators that show the level of participation under the surface. Both charts continue to soar higher, showing a broad level of participation in these rallies. There are no signs of exhaustion here. And next time someone tries to tell you this rally is being led by only a handful of tech stocks, feel free to show them these charts.
Summary
The economic recovery remains firmly in place. There are some signs the growth rate may be peaking, but that is to be expected. I’m watching for the shift in consumer spending from goods to services now that the economy is really starting to reopen. There is a lot of pent up demand for those services that were most affected by the restrictions. This months jobs report reflected that, as the biggest category for job gains came from the leisure and hospitality sector.
As for the jobs report, I thought it was decent overall even though the net jobs gained came in lower than expected for the second straight month. Actually, I think it was a “goldilocks” report in that it was strong enough to show the expansion is still in place, but not too strong as to have any effect on the Federal Reserves current policy. If net jobs gained came in at 1 million, the market might have interpreted that as a precursor for tighter monetary policy. Unfortunately, this is the environment we are in.
Earnings are still great, interest rates are still very low, the economic expansion is still in place, and there remains broad participation in the stock market advance. All this remains supportive of risk assets. Doesn’t mean we can’t have a correction, and 2020 showed us that something can always come out of nowhere and change everything. The inflation concern is real, but there is no reason to get ahead of ourselves at the moment. Next weeks CPI report will be interesting.
This week there are two S&P 500 companies reporting earnings. For economic data we have the index on Tuesday and the increasingly important gauge of inflation via the (CPI) on Thursday.


