Designing and managing portfolios that maximize diversification is challenging in the best of circumstances. In the wake of this year’s coronavirus pandemic, the task has become even tougher.
The problem is particularly acute with conventional asset classes. In our periodic updates on return correlations for the major asset classes (see here, for example), the scope of the challenge is clear: most asset pairings tend to be closely correlated. There are exceptions, of course, starting with the workhorse of mixing stocks and bonds. But across the broad sweep of asset classes, low and negative return correlations are rare.
The standard approach to profiling correlations is with returns. For another perspective let’s examine how correlations for return volatility stack up. The logic here is that in an ideal scenario, assets would exhibit low correlation for return volatility. Why? Volatility tends to spike when returns are negative and so low-vol correlation implies a comparatively rich degree of diversification power. Unfortunately, finding that diversification power with conventional asset classes is difficult – perhaps more so than is generally realized, as the following volatility correlation profiles suggest.
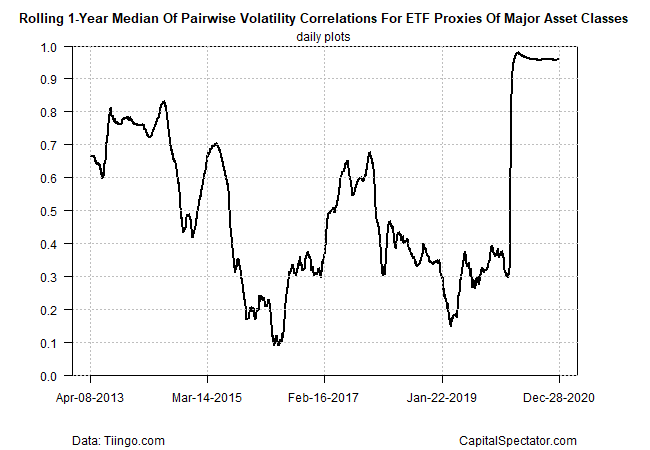
Consider the median of the rolling one-year vol correlation (vol-corr) for the major asset classes via a set of proxy ETFs. To calculate each vol-corr data point, a rolling 30-day trading window is used. In the wake of the pandemic, vol-corr rose sharply, approaching 1.0 and has remained close to perfect positive 1.0 correlation. (Note: correlation readings range from -1.0 (perfect negative correlation) to zero (no correlation) to +1.0 (perfect positive correlation.))
 Volatility Correlations.
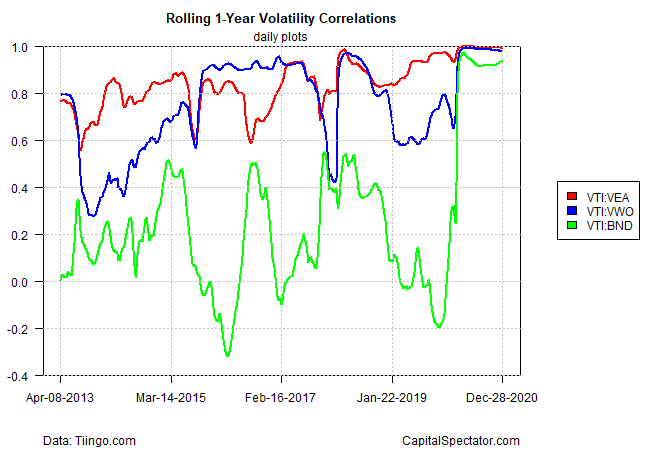
For a more granular view, let’s focus on three pairings for U.S. stocks (VTI) via U.S. bonds (BND), foreign developed-market stocks (VEA) and emerging markets stocks (VWO). As the chart below shows, vol-corr has varied widely until recently.
 1-Year Volatility Correlations.
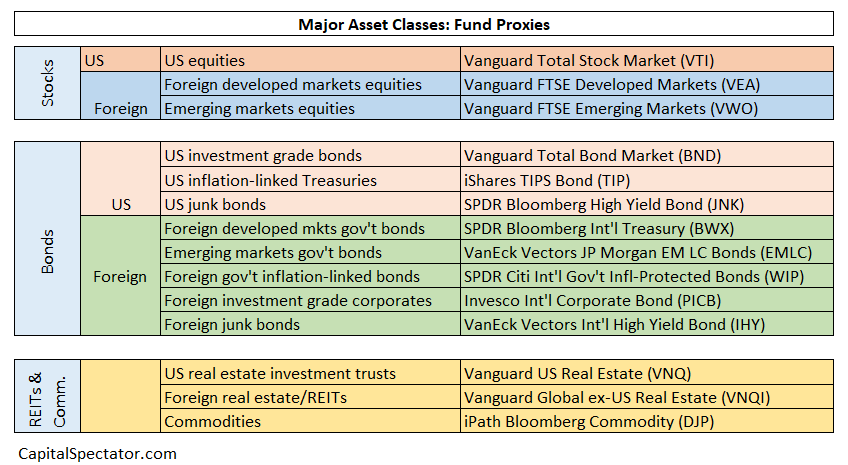
For a broader perspective, let’s run the numbers on all the ETF proxies for the major asset classes, based on the following funds:
 Major Class Assets.
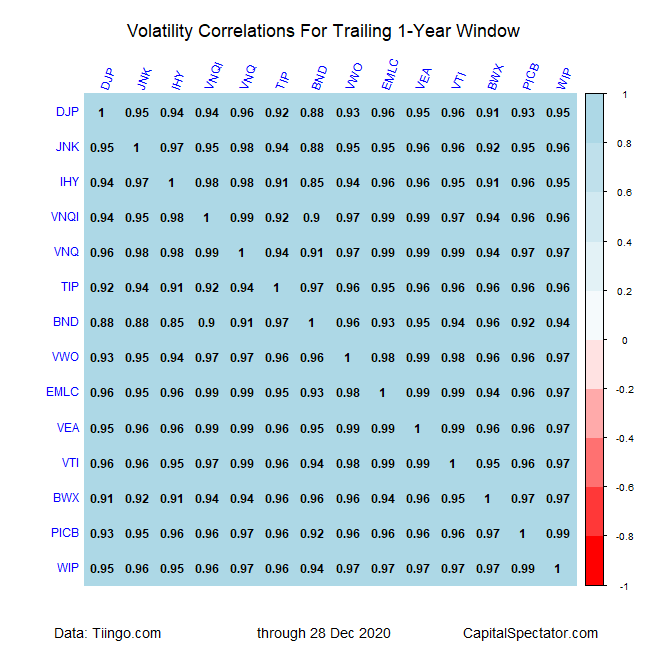
The table below shows that the volatility correlations are high for all the asset pairings, based on a trailing one-year window as of Dec. 28.
 Volatility Correlations.
The key message: volatility correlations remain high across the board. It’s reasonable to assume that vol-corr will slide in the months ahead. Whether we see a return to the “normal” level of correlations is debatable. By some accounts, markets overall have become closely linked in the pandemic and this tight connection will endure.
If so, the opportunities for tapping into diversification’s benefits by holding long-only, standard asset classes will diminish in some degree. On that basis, investors have two basic choices as responses. One, grin and bear it and recognize that multi-asset class portfolios will be more volatile and subject to a higher level of tail risk than history implies.
The second choice: work harder to maintain a certain level of diversification by expanding the opportunity set into so-called alternative asset classes and/or adding tactical measures to the mix. Neither choice is a riskless proposition, but holding a multi-asset-class portfolio comes with higher risk these days, too. Pick your poison.
Leave a comment