Markets are lower in afternoon trading in New York today. China fears have created uncertainty, and why we looked to short the Transports yesterday.
It seems like rough markets have a way of originating in China.
Thinking back to 2007, I remember watching the Chinese markets melt down. This process began well ahead of the U.S. financial crisis of 2008.
Looking back at markets that you have lived and traded through, you amass a mental library of history and look to learn from it. Before 2007, I spent years as a real estate agent and remember the days of people being approved for home purchases on variable ARMs and very low-income requirements. You just knew the music would have to stop at some point as banks loaded up sub-prime borrowers with debt that logic would dictate as unpayable.
The China markets started to crack ahead of the U.S. markets back then.
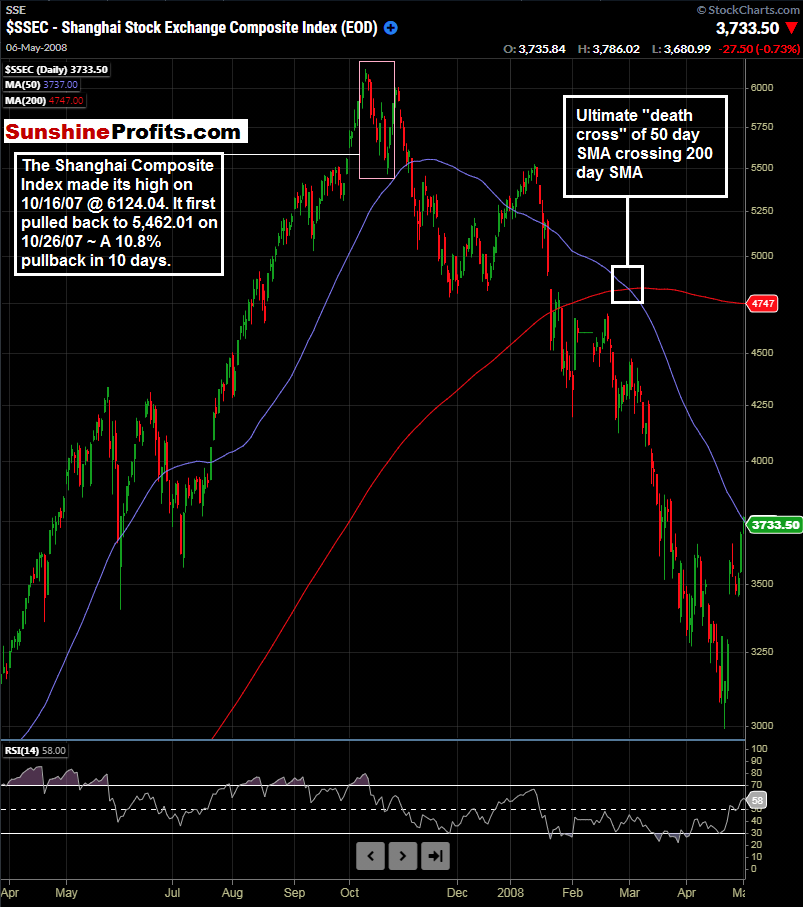
Figure 1 – Shanghai Stock Exchange Composite Index March 24, 2007 – May 2, 2008, Daily Candles Source stockcharts.com
I do remember watching this market at the time. Other China indices fared even worse. Around this time, the experienced a pullback too, but one of a much lesser magnitude.

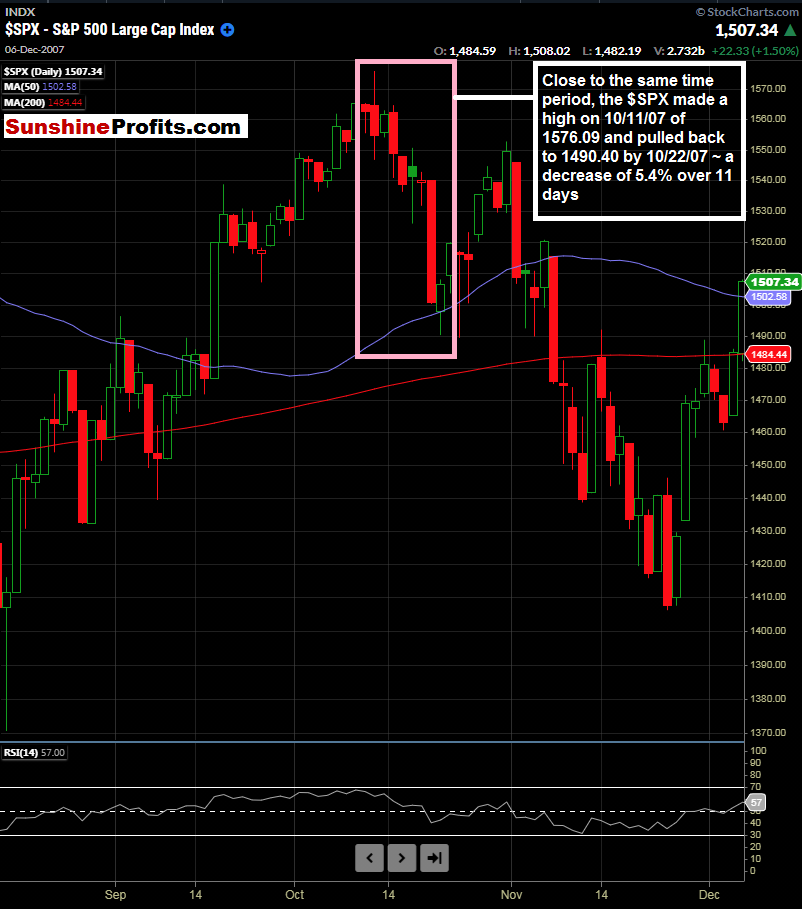
Figure 2 – S&P 500 Index August 1, 2007 – December 7, 2007 Daily Candles Source stockcharts.com
As we can see, the SPX also pulled back around this time, but in more of a pedestrian manner, with a 5.4% pullback over an 11-day period versus 10.8% for China around the same time period.
It is important to note that the SPX had pulled back prior to this time and rebounded to all-time highs. I am mentioning all of this as markets have memories and accelerated moves in China catch my attention. Let’s also mention the obvious here: the COVID meltdown in February-March 2020.
As China is grabbing all of the headlines today, let’s see how the has fared yesterday and today.
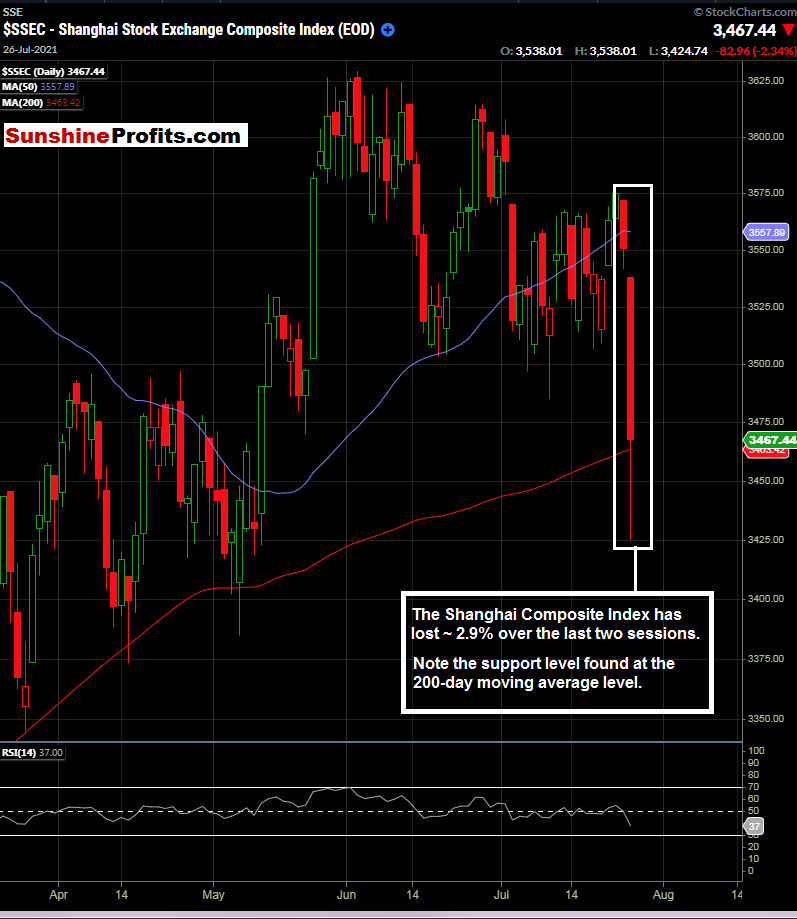
Figure 3 – Shanghai Stock Exchange Composite Index March 17, 2021 – July 27, 2021, Daily Candles Source stockcharts.com
Yes, the Shanghai Composite is lower over the last two days. However, the sky isn’t falling, at least not yet. It is lower by 2.9% or so over the past two sessions. Note the support that was found around its 200-day moving average.
What All Of This Means For Us
I believe it is smart to avoid getting too caught up in the daily headlines, for the most part. Price and divergences can tell better stories than any news headlines, which often come out much too late.
This is the reason that it made sense to target the Transports to the downside yesterday. We had a pattern of lower highs and lower lows, with clear divergence from the direction of the broader markets since May 1. In case you missed it, you can read about the analysis of the Transports in the July 23rd publication and in yesterday’s July 26th publication.
As we targeted the short side of the iShares Transportation Average ETF (NYSE:) yesterday afternoon around $258.00, let’s see how the transports are faring in today’s market down day.

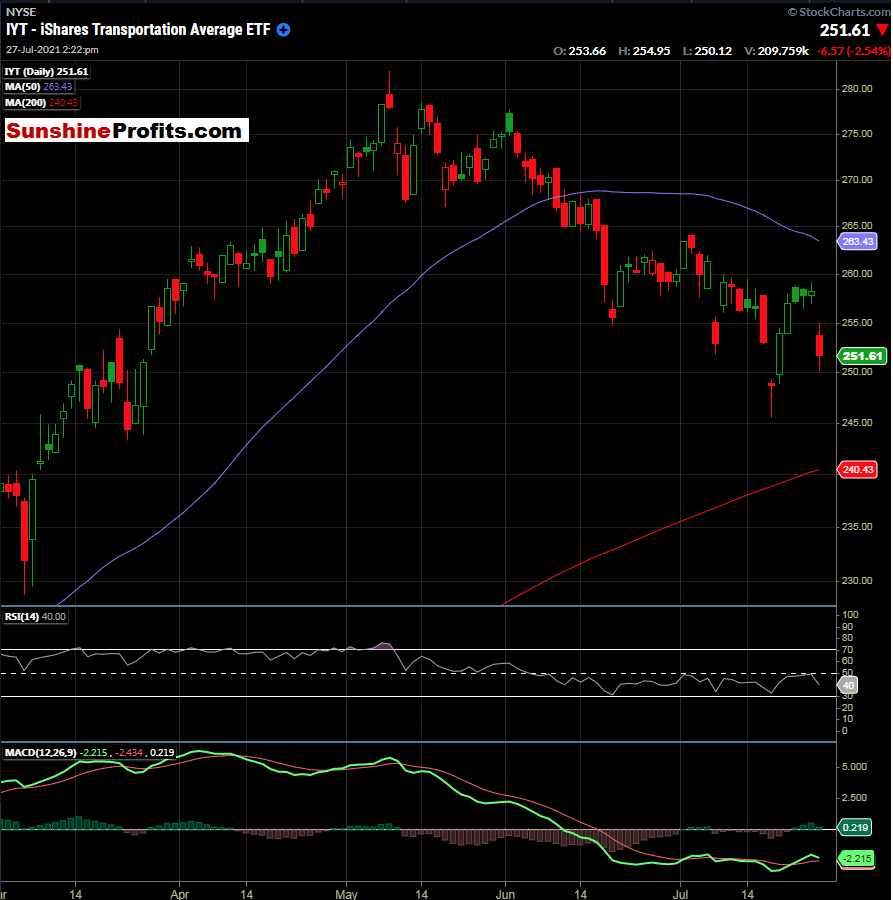
Figure 4 – iShares Transportation Average ETF March 1, 2021 – July 27, 2021, Daily Candles Source stockcharts.com
The IYT is lower by 2.54% as of the time of this writing. As discussed, the Transports were already trading lower versus the broader indices.
Right now, we see the RSI(14) at 40 and daily MACD crossover brewing to the downside with the fast line crossing the slow line.
We Will Hear From Fed Tomorrow
The FOMC statement and subsequent press conference is slated for tomorrow. Those kinds of days can be tough to trade, and depending on the Fed’s tone, anything could happen.


