Thanks to COVID-19 vaccines, which are expected to help countries manage the pandemic and reopen locked down economies, global stocks have repeatedly posted fresh record highs in recent months. Why then are shares of the actual vaccine makers slumping?
Pfizer (NYSE:PFE), which was the first pharama to roll out their immunization for general use, is down 9.5% over the last four days. Shouldn't shares of the New York City-based company be going through the roof?
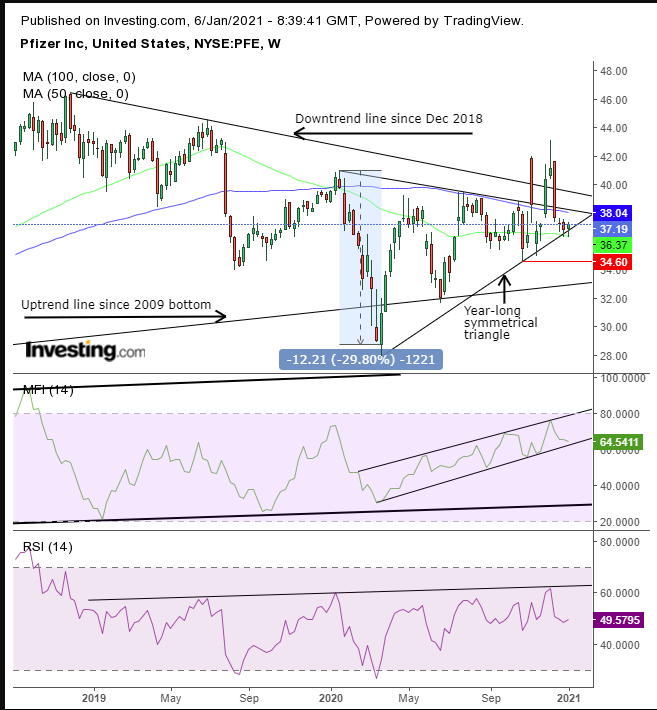
The stock's downward move seems to be another variation of the old market adage, 'buy-the-rumor, sell-the-news.' Since investors bought the stock for its potential, in order to get out ahead of the vaccine's approval and affiliated sales, shares climbed over 50% from the March low to the December high.
 PFE Weekly
But, beginning the week of Nov. 9, some investors decided to lock in profits and the selling started. A month later, beginning the week of Dec. 7, a second wave occurred, forming a long upper shadowed shooting star, followed by the mother of all Bearish Engulfing patterns, with an even longer red candle during the week that started on Dec. 14.
That's the period when sellers were unwinding positions, driving the price down, as they filled all the present demand, then sought additional, more discerning buyers, at lower prices. Ironically, some investors who sold when the stock was in the $40s may well have repurchased at the mid-to-high $30s.
It’s not the identity or number of people buying or selling that moves the market, but the amount of capital changing hands. Now, however, the distribution of that capital on the supply-demand scale is at a tipping point. And we're identifying an upward bias going forward.
The price has been developing a year-long symmetrical triangle, shaped according to the forces of supply and demand. It’s symmetrical because both sides were pushing at the price.
While the pattern follows a decline since the December 2018 high, it 'just so happens' to have developed where it meets with the advance since the March 2009 bottom, suggesting greater interest in that trend.
While the 50-week MA has been supporting the price for a third week now, the 100-week MA reinforces the triangle’s top, underscoring its significance as a bearish stronghold—and the powerful upside move that could be triggered by its breakout.
As well, the stock has already provided back-to-back upside breakouts, one of which included the downtrend line. Bears may have then pushed the price back down, but the bottom of the pattern held. In fact, it has rebounded this week right off its bottom, demonstrating its technical significance.
The Relative Strength Index (RSI), which measures price momentum, has been forming a bottom, whose upside breakout above 63 would signal a reversal in momentum to the upside.
The Money Flow Index (MFI), which measures the momentum of both price and volume change, supports the rising price, both in the short-term, by trending within its rising channel between the March low and the present, as well as in the long-term, within a rising channel since 2016.
Finally, the price’s position provides a rich, risk-reward ratio, since it's on the very bottom of the pattern. The price objective is $12 from the point of breakout, to an estimated target of $50.
However, if the price falls below $34.60, we would be concerned the tide may have shifted, with a low below the Mar. 23 bottom putting it in a full-on downtrend.
Trading Strategies
Conservative traders should wait for the price to post a new high, above $43.08, to re-establish the dominance of the long-term uptrend since the 2008 bottom over the medium-term downtrend since the 2018 high.
Moderate traders may be content with a close above the downtrend line, if not the symmetrical triangle.
Aggressive traders may enter a long position now.
Trade Sample
- Entry: $37
- Stop-Loss: $36
- Risk: $1
- Target: $43
- Reward: $6
- Risk:Reward Ratio: 1:6
