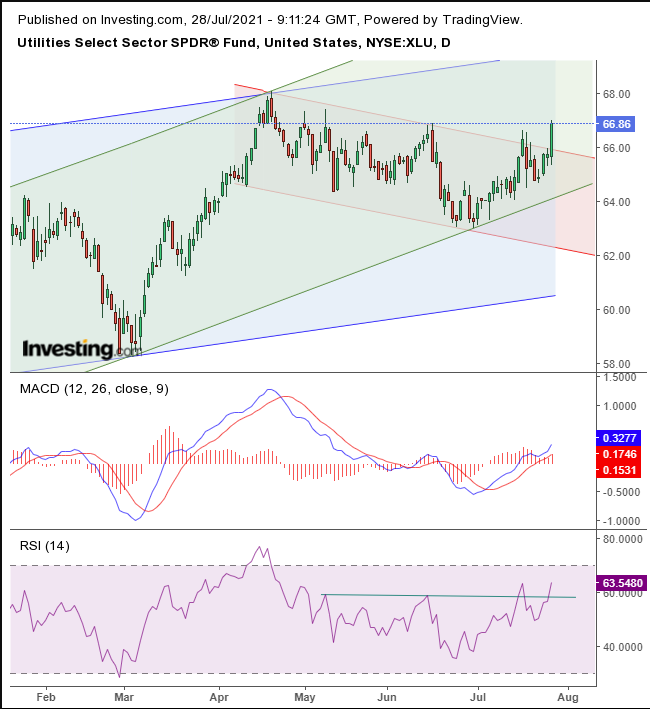
Though US stocks dropped on Tuesday, ending a five-day winning streak, for savvy traders who knew where to look, there was still one sector that provided value along with significant gains. The index may have been down by 0.5%, but the ETF proxy for the utilities sector, the Utilities Select Sector SPDR® Fund (NYSE:) surged 1.7%.
Yesterday’s second-best sector performer, managed to climb just 0.8%, half that of Utilities.
For quite some time now, the drab, but highly defensive utilities sector received little attention, except perhaps from retirees looking for richer than average dividend yields, a staple of many utility shares. Most investors have been focusing on the value verus growth scrimmage that’s been taking place as markets whipsaw between optimism of a reopening economy vs. worry about rising pandemic levels across the globe.
However, yesterday’s outperformance by utilities signals a possible new player in the current market tussle. Was this a one-off, or might there be a strategic shift beginning to play out? We think the latter.
We cross-examined sector performance and believe there’s a subtle but real shift in play. Not only did the ETF outperform on Tuesday, but it has been one of four sectors that has added at least 2% on both a weekly as well as monthly basis.
What’s more, though the other sectors that climbed at least 2% have been alternating, utilities were the only sector that consistently accelerated by 2% during those periods.
Here’s what that dynamic looks like on the chart:

XLU Daily
XLU provided an upside breakout to its falling channel since the April high, which may mean not only that the falling (red) channel was merely a temporary correction amid the broader (blue) rising channel since April of last year, but that a faster rising channel may be developing (green), which would complete when the price posts another high.
The MACD provided a bullish cross right after the price bottomed out within the red channel, while the RSI bottomed out along with each of the two upside breakouts of the same red channel—showing momentum was supporting the price.
Trading Strategies
Conservative traders should wait for the price to clear the previous, June 16 high, where it now finds resistance for the second time, then retrace its steps and demonstrate ongoing support, before participating with a long position.
Moderate traders would wait on a long for the same movement as conservative traders but for the closer entry, not necessarily for confirmation.
Aggressive traders may buy at will, provided they are prepared for whipsaws. Money management is key. Here’s an example of a trade plan:
Trade Sample
- Entry: $66
- Stop-Loss: $65
- Risk: $1
- Target: $68
- Reward: $2
- Risk:Reward Ratio: 1:2
Author’s Note: This is a sample, not the actual analysis. That’s in the body of the text. If you didn’t read and understand it, don’t trade. The sample is not the only way to approach this trade, and it may not suit you. Before entering a trade, imagine you’ve already lost it. If you can’t handle that, don’t enter the trade. Trading is nothing more than “luck management,” and we can’t know the future. What we attempt to do here is get on the side of statistics. That means the more trades, that adhere to statistical outcomes, the more likely one is to succeed overall, rather than on a trade-by-trade basis. Your budget, temperament and timing will impact the results of your trades. Until you learn how to customize them, follow our samples, to learn, not profit, or you’ll end up with neither. Guaranteed. No money back.

