Cement producer Cemex (NYSE:) stock has been surging on the heels of the housing boom and further accelerated by the prospects of more demand fueled by the Biden infrastructure bill. The stock has been both a pandemic and re-opening play beneficiary. The Company saw a surprising surge in demand for cement products in the second half of 2020, which may continue to have an extended runway with the impending infrastructure buildout. Building materials like steel and cement are no-brainer winners, which is why shares of these materials companies have skyrocketed. The maker of cement, asphalt, ready-mix concrete, and aggregates essential for construction, roads and highways is in the sweet spot. Prudent investors should anticipate the sell-the-news reaction and administer patience to wait for opportunistic pullback levels to gain exposure in the construction materials space with Cemex.
Q4 2020 Earnings Release
On Feb. 11, 2021, Cemex released Q4 2020 for the quarter ending in December 2020. The Company reported GAAP earnings per share (EPS) of $0.06 excluding non-recurring items, beating consensus analyst estimates of $0.03, by $0.03. Revenues grew 8.6% year-over-year (YoY) to $3.54 billion, beating analyst estimates by $210 million. The Company saw 15% YoY cement volume growth in the U.S., it’s largest market. The U.S. segment also provided the highest quarterly EDITDA at $186 million with 18.% margin, up 25% YoY. The strongest U.S. segments were California, Arizona, and Texas. Mexico accounted for 17% volume growth. The Company acquired Texas-based, Beck Readymix. The Company has three cement plants in San Antonio, TX, and a mobile plant. This acquisition prepares Cemex to add additional capacity.
Conference Call Takeaways
Cemex CEO, Fernando Gonzalez, set the tone:
“Despite the enormous disruption of COVID-19 throughout our operations, we were able to close the year with a 7% expansion in EBITDA on a 1% rise in sales. EBITDA growth was largely driven by pricing and Operation Resilience. We posted the lowest OPEX as a percentage of sales in our history in 2020.”
The Company the first of many upcoming asset sales ($50 million) in efforts to reduce debt. Under Operation Resilience, the Company achieved $280 million in cost savings from reductions in travel, sales, head count and fee expenses. Up to 70% of the savings are expected to be recurring throughout 2021.
Carbon Reduction Plan
Cemex is also pursuing carbon reduction as CEO Gonzalez reiterated:
“In February, we rolled out our sustainability goals for 2030 and 2050. The goals are aggressive with a commitment to reduce carbon by 35% by 2030 and an ambition to deliver net-zero concrete globally by 2050.”
The Company reduced clinkers factor by 1.1%, which was the largest decline in five years.CEO Gonzalez stated:
“We retrofitted all our plants in Europe to utilize hydrogen injection. This will allow us to achieve a higher alternative fuel substitution as well as reduced heat consumption in a significant way. We are now expanding hydrogen injection to the rest of our operations.”
Tailwinds
The Biden infrastructure plan is cause for major tailwinds as roads and highway construction projects will be a major demand aggregator. The plan will be heavily debated in Congress with lots of provisions and adjustments, but the tailwinds for construction materials companies like Cemex can’t be denied. Prudent investors should administer the patience to wait for opportunistic pullback levels to gain exposure on this infrastructure play.

CX Opportunistic Pullback Levels
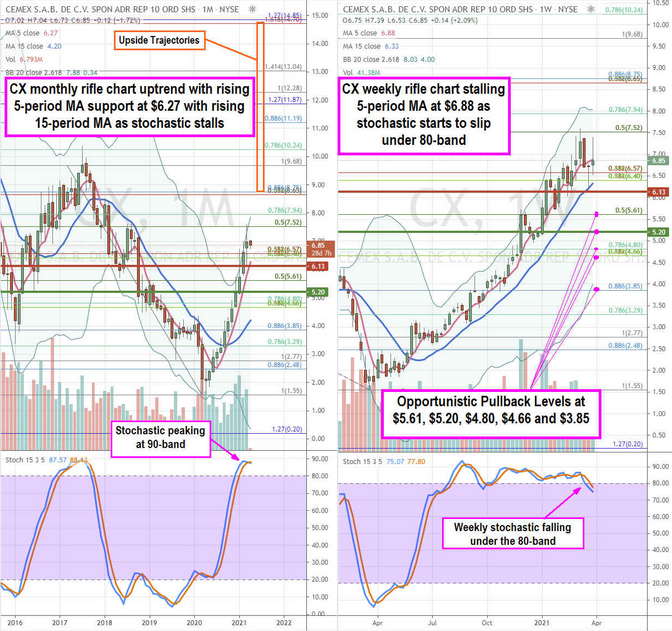
Using the rifle charts on monthly and weekly time frames provides a broader view of the landscape for CX stock. The monthly rifle chart has a been in a parabolic uptrend with a rising 5-period MA support at $6.27 peaking at the $7.52 Fibonacci (fib) level. The monthly stochastic is also peaking at the 90-band indicating a momentum slowdown. The upper Bollinger Bands (BBs) sit near the $7.94 fib. The weekly rifle chart uptrend is stalling with a flat 5-period MA at $6.88 and upper BBs at the $7.94 fib. The weekly stochastic is falling under the 80-band as momentum is starting to reverse. The weekly market structure low (MSL) buy triggered above $5.20 while a weekly market structure high (MSH) triggers on a break under $6.13. The impending sell-off can provide prudent investors with opportunistic pullback levels at the $5.61 fib, $5.20 fib, $4.80 fib, $4.66 fib, and the $3.85 fib. Upside trajectories range from the $8.75 fib upwards to the $14.70 fib level.

